
If you have a website, it better helps you reach your objectives. It doesn’t matter what your business is. This is why website KPIs are very important. But there really isn’t a list of best website KPIs set in stone. These depend on what your company is and what you want out of your digital touchpoints. This, of course, includes your website.
In this article, we are going to explore which website performance KPIs you need to track depending on your situation. Of course, this will be a general approach. Hence, you have to figure out the right mix for you. All we’ll do is help you see the bigger picture before you dive into the deep end.

Best Website Performance KPIs Table of Contents
It is pretty common these days for people to tell you that you need a website up and running. They say we are in the digital age. Thus, you need to be visible digitally. Sure, this is true as search engines drive 93% of website traffic.
However, visibility is not the only thing that you want. Of course, we want customers to know what our companies do and how we can help them. But doing so is not that easy. And again, it is not the ultimate goal. You can have all the visibility you want but that doesn’t mean you get customers to do what you need them to do.
Also, you have many competitors when it comes to getting seen online. This includes your direct competitors and other organizations or entities that vie for keyword domination in SEO. This means you have to fight for attention too; the right kind of attention.
This is why SEO is very important in today’s environment. However, this gets complicated as mentioned as visibility and rankings are not the holy grail anymore, and rightly so.
Before, many marketers and clients believed that rankings and traffic are the most important KPIs. This is not the case.

Today, 66% care more about conversions and revenue. This, in a sense, is a paradigm shift that puts outcomes first rather than just performance aspects. To wit, this shift puts more focus on KPIs more than mere metrics. So before we go on to our list, we’ll explain how this works first.
How do you evaluate the performance of a website?
The quick answer is that this depends upon your business objectives. However, we’d like to share a quote from Avinash Kaushik, the inventor of the “web analytics 2.0” paradigm:
“The analysis of qualitative and quantitative data from your website … to drive continual improvement of the online experience that your customers, and potential customers have … translates into your desired outcomes (online and offline).”
This strongly implies a website is up and running not just to be up and running. It has to fulfill the desired business outcomes that are online or offline. Furthermore, this depends on what kind of business you are running. Meaning, you should evaluate the performance of your website based on the performance of your overall business.
Your website should be treated as an integrated business process among other business processes that contributes to the synergy of reaching goals. Therefore, you need to align your objectives with metrics and KPIs.
However, is there really a difference between them? What does each of them have to do with each other?
What is KPI in Website Analytics?
We could look at these three things simply. Objectives are your desired outcomes that answer the question, “What are you hoping to accomplish for your business by being on the web?”
These objectives should be DUMB: Doable, Understandable, Manageable, and Beneficial. Furthermore, these need to be drilled down into goals like “identify inefficiencies in X,” “try out different campaigns for segment S,” etc.
On the other hand, metrics are numbers that can be a count (total) or a ratio (a number divided by another). These help us see specific performance aspects that are quantified.
However, each of these has variable relationships with objectives and goals. Some may be goals themselves that help fulfill an objective. Others may just be complimentary things that do not affect goals or objectives much. KPIs or Key Performance Indicators are also metrics but they are quite special.
KPIs help you understand how you are faring against your objectives. This means they are closer to the heart of your business. They measure where you are against where you want to be in the future.
Website KPIs examples for an eCommerce site are conversion rate, revenue, average order size, quantity, and the number of transactions.
Examples for a website with a display advertising model could be views, users, session time, banner clicks and the likes.
You get the point. There are different KPIs for different organizations although they may have the same types of metrics available.
What should I track on my website?
As we are dealing with a general case, let us assume that you have a website that ultimately leads to sales, repeat purchases, and brand loyalty. This is basically what a website should do and what everything else in your business should do. You gain and retain customers continuously, profitably, and better than your competition.
Thus, we will discuss three classes of website KPIs to track:
- SEO KPIs
- UX KPIs
- Sales KPIs
Why track SEO KPIs?
SEO KPIs are most likely the very basic SEO metrics out there. These have something to do with rankings and traffic. But why track these?
SEO metrics tell you how your website is visible to users via a web search engine.
This is perfect for users who look for specific answers for specific questions without a go-to knowledge base or site.
Also, as search engines are usually where your queries are sent to by your mobile browser, websites will do well when they are the first ones that rank on the search results page.
Thus, having a good SEO ranking ensures new traffic. This is why you need to invest in tracking SEO metrics and KPIs.
Source: Net Marketshare
Moreover, the most popular web search engine is Google. At the time this is being written, Google leads as the market leader of all search engines worldwide with an 81% market share.
It also helps that Chrome, Google’s browser, takes 65.12% of browser market share as well. Baidu posts as the far second “contender” for the top search engine. It only has 10.11% of world market shares.
This is for searches from both desktop/laptops and mobile. Therefore, it is wise to keep yourself updated on Google policies for SEOs.
Why track UX KPIs?
UX or user experience is very important nowadays. This is especially true with digital natives such as Millennials and Gen Zers. It doesn’t matter what your business is.
You want your website to be intuitive and user-friendly. Also, you don’t want to lose a sale just because the customer finds it hard to pay on your site. You want a balance between functionality and user-friendliness.
Of course, this takes time in creating, developing, and testing designs.
UX Challenges to Overcome, 2018
Source: toptal
Designed byAccording to toptal, slow-loading websites are costing retailers more than $2 billion in sales a year.
You don’t want to be a part of this statistic. Thus, you need to track UX KPIs like load time per browser and device among other metrics.
Why track Sales KPIs?
Well, this is really a no-brainer.
We track sales KPIs in order to find out where we are with our sales goals relating to our overall business objectives.
Of course, it is one of the main objectives for businesses to sell whatever they are selling. However, there are many ways to go about this in relation to having a website.
First, you sell on your website. We call this eCommerce. This is easier to track as there are eCommerce platforms with reporting tools to keep you up to date with how you are doing.
Secondly, if you don’t sell via your website but you have brick-and-mortar shops (e.g. fine-dining restaurants, etc.), you need to integrate the data from your accounting software with your website metrics such as conversion rate (e.g. reservations, promo codes, inquiries, etc.).
This is where business intelligence platforms will be handy. However, this needs to be connected with SEO somehow.
Source: 2Checkout
As you can see above, many eCommerce sites are pretty problematic when it comes to SEO. Many are hard for search engines to crawl.
Also, most are found by search engines to be insecure. Thus, Sales KPIs need to be viewed and approached in an integrated manner with SEO KPIs and UX KPIs.
Now, let’s get into the specifics of each class of general website KPIs.
SEO KPIs
Here are popular SEO KPIs that you need to track. These are the basics of how to measure website performance on SEO metrics alone.
Also, at times, these are all you need especially if you only use your website to increase visibility for your offline products. Or use it primarily for customer support like giving out tutorials and valuable information regarding your product’s use.
However, if you sell something on it, these KPIs are not enough.
Sessions
These are a period of consecutive activity by a particular user. A session keeps on persisting until a user stops interacting with the site for 30 minutes. This is called the timeout length.
Also, this is the default setting on Google Analytics. This is a good KPI as it indicates how long a user interacts with your site. The longer he or she interacts, the more interest or engagement you are likely getting.
Users & New Users
Users or visitors measure the number of unique visitors your site is getting for a time period. This is used to get an idea of the overall size of your audience base.
On the other hand, new users are the visitors who come to the site for the first time given a certain period. Thus, these are valuable KPIs when you want to grow and maintain your user base.
Corollary metrics that can be KPIs are demographics. This is especially useful when your targeting is based on gender, location, and other similar attributes.
Bounces & Bounce Rate
Bounces are sessions up to only one page. Also, this is where the user closes the browser on the first page they landed.
Again, like sessions, this is a good KPI as it shows you how engaging your site or your content is for your target audience.
Furthermore, you can also get metrics for which pages get the most bounces. Thus, you would know which pages to improve on.
On the other hand, Bounce Rate is the number of sessions with bounces divided by the total number of sessions. This KPI helps you get a more general picture of how interesting your site is for your visitors.
The two complement each other.
Organic vs. Paid Sessions
Organic sessions are those resulting from “unpaid” search results.
This is traffic from users who used search engines to find your website.
On the other hand, paid sessions are those resulting from clicking banner ads. They are sessions “referred” to by other websites especially those that you paid to suggest your address. This also counts paid search engine listings. Thus, these are good KPIs to understand where your traffic is coming from.
As a rule of thumb, if you get more traffic from organic searchers, this means that you are publishing quality content or you publish regularly.
Thus, if you don’t get many organic searchers, managing your content better is a good way to go. A good content marketing platform could help here.
We recommend HubSpot for this as it has a rich feature set. If you want to check its comprehensive feature set you can easily sign up for a HubSpot free trial here.
Moreover, to improve your paid sessions KPI, you can go for social media advertising to complement your display advertising. With these KPIs in relation to new users or old users, you’d get a general idea of how you can increase your audience base and engage them.
Top 5 Search Queries
These are search queries or keywords that get you the most visits or sessions. Also, you should take a look at where they are coming from in terms of organic and paid sessions.
Once you know these KPIs, you’d understand which keywords that you want to “own” in terms of getting the top search engine results for these topics.
These give you a chance to be a leader in the conversations that these keywords are a part of. Thus, having these metrics as a KPI can help you gain, retain, and grow your online customer community.
Referral Sites
Referral sites bring visitors to your website. This is an important KPI when you are doing outreach marketing or coordinated marketing with non-competing firms.
An example of this is that if you are a food processor business, you team up with a knife or utensil business to create content and share audiences.
Also, if you are not up to this, this metric shows you which sites refer users to your webpage. This can be Facebook, Twitter, or some blogger’s site.
Thus, you’ll know which website to put more attention to get more customers on board.
UX KPIs
As mentioned, you want your site to be well-designed in order to gain and retain customers. Also, you don’t want to lose audiences and sales just because your site is hard to access on whatever browser or device.
Thus, you need to keep your eyes on some metrics that you can consider as KPIs.
Here are some below.
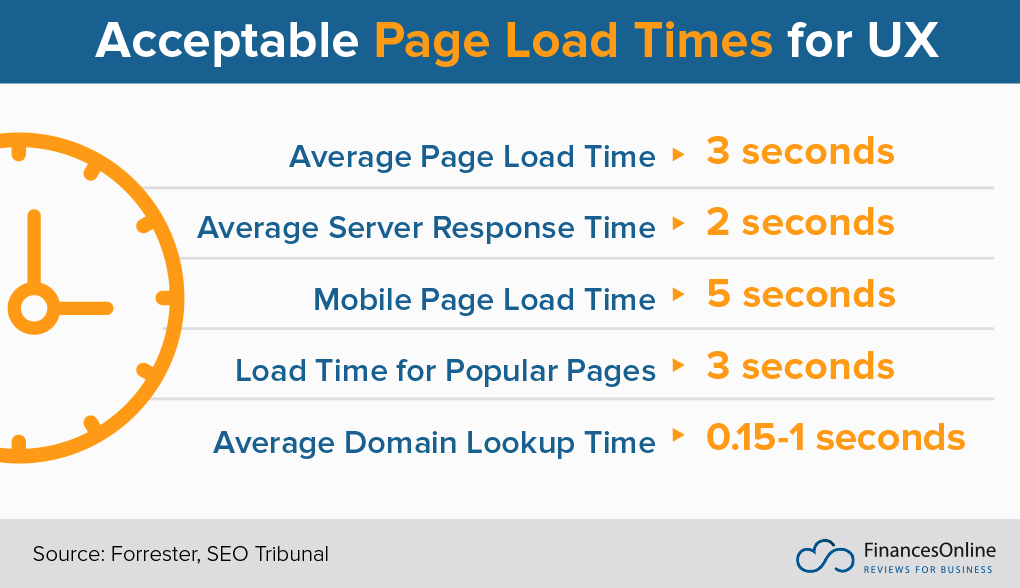
Average Page Load Time
The average page load time is one of the most important website key performance indicators.
Remember, 53% of mobile site visits get abandoned when pages take longer than three seconds to load. This is a key KPI that will tell you whether your site is conducive for users to interact with.
Also, you have to consider that many marketers and users seem to point out that load speed affects website SEO rankings as well.
There are different metrics for this really. This is because different people access your site using different devices are browsers.
Thus, you should keep track of certain load times.
Bounce Rate Per Browser
Again, this relates to the first KPI.
You wish to optimize your site to load properly and quickly for every browser available in the market, especially the ones that most of your audiences use to connect to you.
Many issues occur after updates. Thus, you should watch out for browser versions being used by your target audiences.
Gender and Best Pages by Gender
Now, there are sites that are male users-heavy. An example of this would be sports sites.
Moreover, there are also sites that cater to both genders such as eCommerce sites. Thus, you need to keep watch of your users, age distribution, and what pages are popular with them. This helps you create content or curate product pages better.
Let’s say women from the age of 15 to 35 like certain products A, B, and C. Then it’s best to cross-promote products in respective pages. Or you can have all of them under one catalog or article.
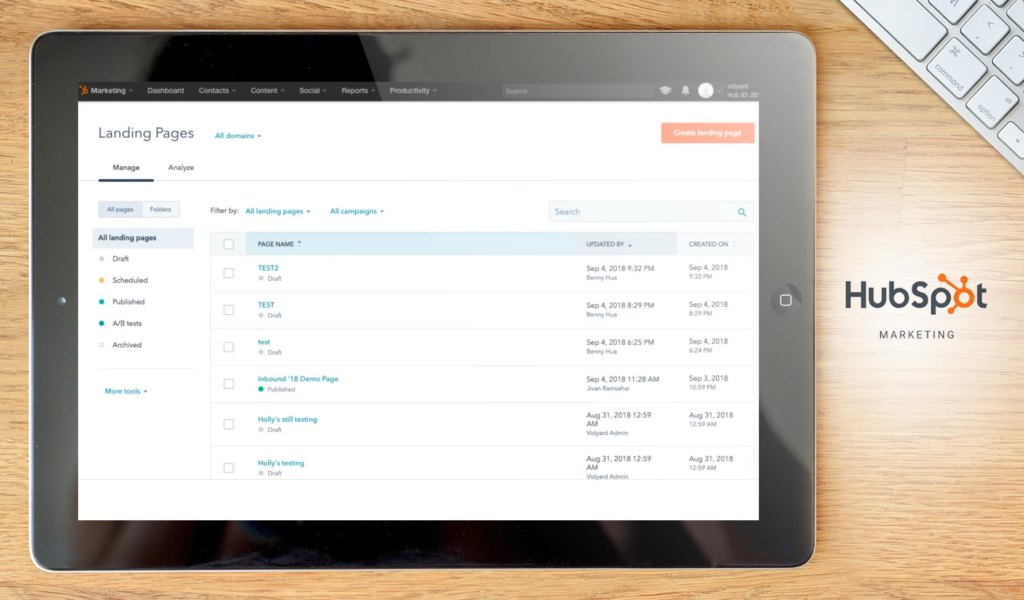
Top Ten Landing Pages
This KPI lets you understand the topics or content that most of your audiences consider being relevant to your site.
According to datapine, more than 90% of traffic comes from a maximum of 10% of all your landing pages.
Therefore, monitoring this would allow you to make important content decisions in the future. Also, there are many metrics that you can use for this KPI.
This includes Sessions, Users, Bounce Rate, and others discussed before. Therefore, there are nuances in this KPI that needs the right intuition and execution to measure well.
Net Promoter Score
The Net Promoter Score (NPS) measures the willingness of customers to recommend your products, services, or your site to other people. This helps gauge not just overall satisfaction but also brand loyalty.
Also, it is primarily an index that ranges from -100 to 100. The higher the score is, the better customer satisfaction, brand loyalty, and customer advocacy are for your brand.
This is usually taken by using surveys. You ask customers whether they would like to recommend your brand on a scale of 1 to 10.
Those who score 6 or less are called Detractors. They are those that are not very likely to recommend your company to people they know.
The Passives are the ones who score 7 or 8. These are those that won’t likely spread negative word-of-mouth but are not really high on your product to begin recommending it to others.
Lastly, the Promoters are those who filled out 9 or 10. These are your loyal customers and you can consider them to be brand evangelists.
You compute NPS by subtracting the percentage of detractors from the percentage of promoters leaving the passives behind. The remainder is your NPS score that ranges between -100 to 100.
Sales KPIs
These Sales KPIs are not just only for eCommerce websites. If you only do offline sales, these can work out for you as well.
Again, like good analytics practice, you should be using all relevant information to gain insights. This means that you should gather and integrate offline sales and lead generation information to your website metrics to see the whole picture.
Some offline aspects affect online touchpoints and vice versa. Therefore, you should create the right mix of metrics to make these common Sales KPIs work with other metrics.
Transactions
These are just the number of transactions that you have had in a given period. This is usually included in your online sales platforms.
Reports are usually easily generated in weekly, monthly, quarterly, or yearly forms.
Also, you can customize the time period that you need to look at.
This is an important KPI as this relates to how much your effort converts visitors into customers.
This brings us to the next metric and KPI.
Conversion Rate
This is calculated by dividing the number of transactions by the number of sessions. This measures how many times you have to have a visit before you get a sale. Thus, this informs you how much more you have to work on getting sessions until you get a sale.
So, the intuition is that in some way, the number of visits influences the number of transactions you have.
However, you can use the conversion rate for any desired action like the number of downloads, chat, comments, shares, and things that you desire your audiences to do.
Quantity
This is the total number of items being purchased. This is related to Transactions but some transactions involve multiple items.
Thus, knowing the quantity could help you with knowing how many products or services you offer fly off the shelf at a given period of time.
Also, this is related to your sales quota. This KPI tells you how you are doing against your ideal sales performance.
Revenue
This the total sale revenue in transactions excluding tax and shipping costs. This is really a no-brainer as it helps you understand how much you are getting from your sales transactions.
You are able to understand how much you are getting in certain periods of time versus how much you want to get during those time periods and in the future.
Tools for Tracking Website Performance KPIs
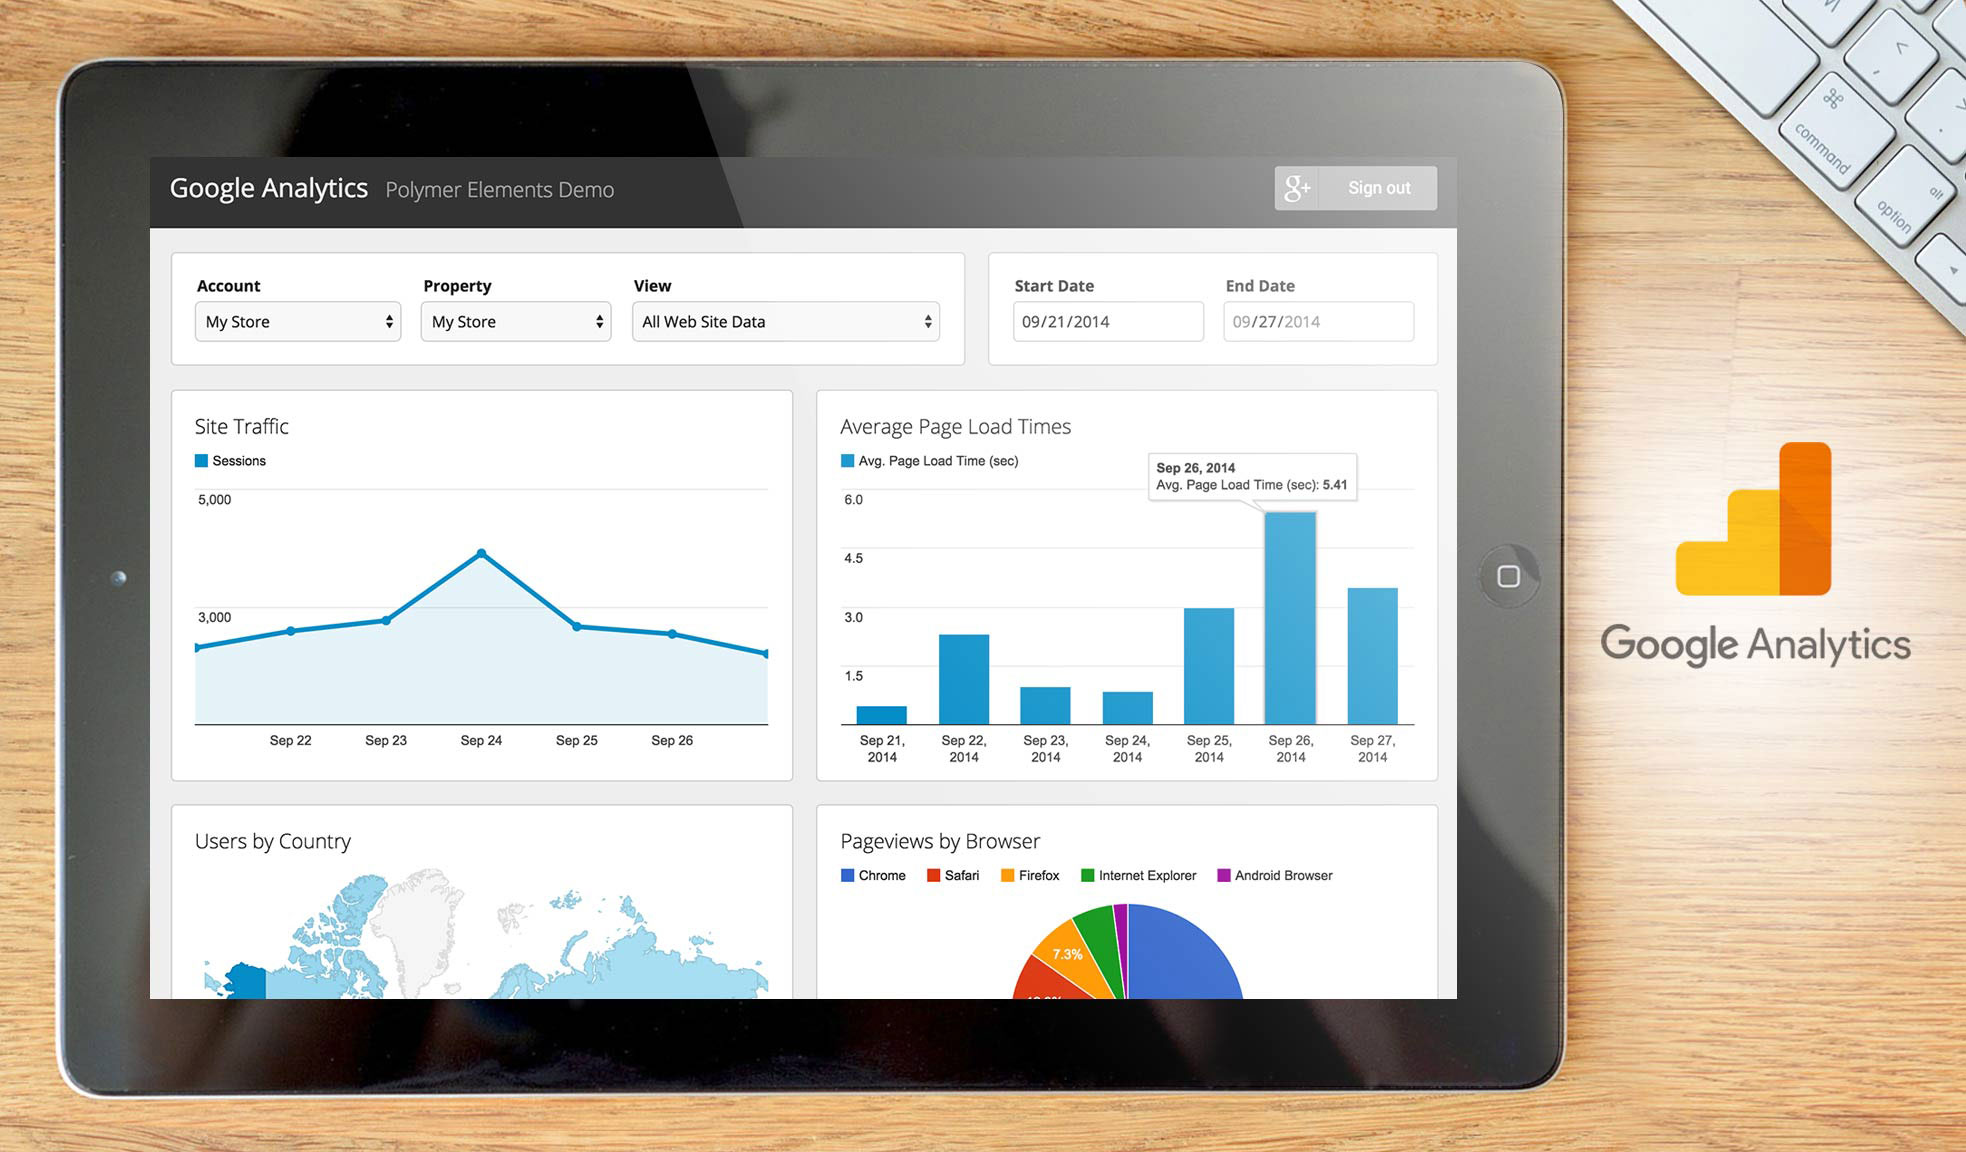
Google Analytics, first name among equals in SEO
As there are different KPIs for different operations, there are also different tools that can help you track these KPIs.
For SEO, Google Analytics is one of the go-to apps for you. You can set up customized goals and group different metrics to view your KPIs. Also, it has enhanced eCommerce capabilities allowing you to track your customer funnel.
Furthermore, you can conduct advanced analyses for products and categories.
Moreover, you can pull data out of the platform and move it to Excel and unto business intelligence platforms.
In essence, it is the main tool in your technology stack. Of course, for a more powerful KPI tracking, you should add more stack into it.
You can add Facebook and other social media management tools to round out your data for more powerful analytics and insights. HubSpot Marketing comes highly recommended by our experts.
The vendor offers a comprehensive free trial to get you up to speed with the features. You can sign up for a HubSpot Marketing free trial here.
Finally, in practice, you have to build your own technology stack that works for you. There is not one single recipe for this. Like many things, it is a trial and error type of thing. We hope this helps and good luck with finding the right technology stack!
Key Insights
- Understanding KPIs: Key Performance Indicators (KPIs) are crucial metrics that help measure the success of a website in achieving business objectives.
- SEO KPIs: These include metrics such as sessions, users, bounce rate, and top search queries. They help in understanding how visible your website is on search engines and the quality of traffic it receives.
- UX KPIs: User Experience KPIs like average page load time, bounce rate per browser, and net promoter score are essential to ensure a user-friendly and engaging website.
- Sales KPIs: Metrics such as transactions, conversion rate, quantity, and revenue are vital for tracking the performance of an eCommerce site or any site aimed at generating sales.
- Importance of Tracking KPIs: Tracking KPIs is important for continuous improvement of the online experience, aligning website performance with business goals, and making informed decisions based on data.
- Tools for Tracking: Google Analytics is a key tool for tracking website performance. Other tools include social media management platforms and business intelligence software.
FAQ
- What are the most important KPIs for my website? The most important KPIs depend on your business objectives. Common KPIs include conversion rate, revenue, average session duration, and bounce rate. For eCommerce sites, additional KPIs like average order size and number of transactions are critical.
- How can I improve my website’s SEO performance? Improving SEO performance involves optimizing content for relevant keywords, ensuring fast page load times, acquiring quality backlinks, and regularly updating the website with fresh and relevant content. Using tools like Google Analytics to track SEO KPIs can help identify areas for improvement.
- What should I do if my website’s bounce rate is high? A high bounce rate indicates that visitors are leaving your site quickly. To address this, improve page load times, ensure your site is mobile-friendly, enhance the quality and relevance of content, and make the navigation user-friendly. Analyzing which pages have high bounce rates can help pinpoint specific issues.
- Why is tracking UX KPIs important? Tracking UX KPIs is important because a positive user experience leads to higher engagement, better retention rates, and increased conversions. Metrics like average page load time and net promoter score provide insights into how users interact with your site and how likely they are to recommend it.
- How do I track the effectiveness of my marketing campaigns? To track marketing campaign effectiveness, use KPIs such as referral sites, organic vs. paid sessions, and conversion rates. Tools like Google Analytics and HubSpot can help you measure these KPIs and provide insights into which campaigns are driving the most traffic and conversions.
- What tools can I use to track my website’s KPIs? Google Analytics is a fundamental tool for tracking a wide range of KPIs. Additionally, you can use social media management tools, business intelligence platforms, and specialized software like HubSpot to gain a comprehensive view of your website’s performance.
- How often should I review my website’s KPIs? It is advisable to review your website’s KPIs regularly, such as weekly or monthly, to stay informed about performance trends and make timely adjustments. For critical metrics, real-time monitoring may be beneficial to promptly address any issues that arise.


Leave a comment!