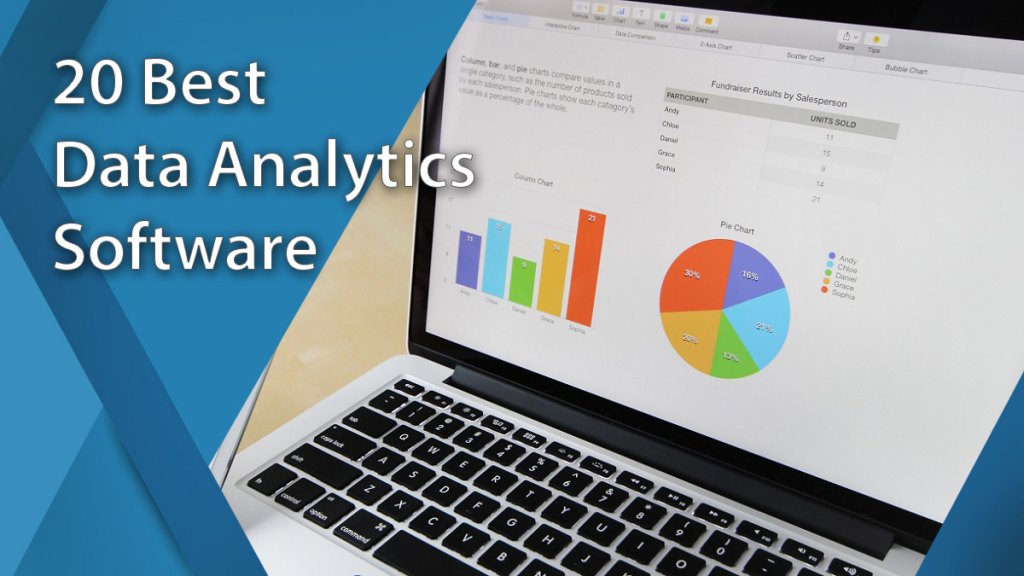
20 Best Data Analytics Software for 2024
The best data analytics software for 2026 is Sisense because of its robust functionalities for consolidating, analyzing, and visualizing data. Moreover, this platform has a flexible and scalable interface that lets it handle both simple and complex data sets, making it great for all business sizes.
The digital age has made it easier for professionals to access data that would allow you to optimize your business performance. However, to leverage this information, you will need data analytics software that can provide you with tools for data mining, organization, analysis, and visualization. Moreover, it should be equipped with AI and advanced algorithms to transform your raw data into valuable insights instantly. This way, you can keep up with business trends, and even find ways to further improve your overall operations.
However, there are plenty of factors involved in finding the right analytics tool for a particular business. From checking its performance to figuring out how well it plays with other systems, the research process can be overwhelming. So, to help you, we have compiled the leading products on the market and assessed their functionalities and usability. This way, it will be easier for you to determine the best possible data analytics platform for your operations.
What are the 20 Best Data Analytics Software Systems?
Technology has made sure that data collection isn’t a problem. However, what many companies struggle with is data analytics, where raw data is processed into valuable, usable business insights. This conversion of data into patterns and trends is one of the biggest challenges in data analytics today, and it’s one that is easily resolved through advanced data analytics software.
Even with 50 billion devices collecting data by 2020, data analytics software can help make sense of all those numbers. These platforms can help analysts and professionals identify patterns, create visualizations, and make data-based predictions for business use.
The most advanced data analytics solutions come with features that simplify the process, so even non-technical users can get useful data-driven insights and interactive visualizations with just a few clicks.
Source: Whishworks
In this article, we’ve gathered the 20 best data analytics software today and discussed each system’s most important features. This way, you can determine which data analytics platform best suits your needs.
1. Sisense
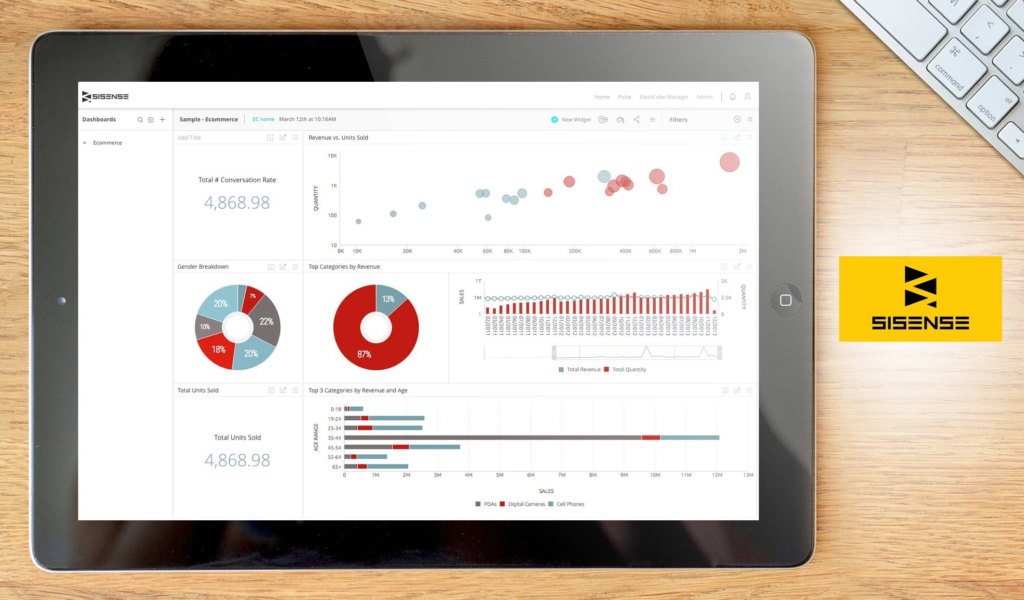
Sisense offers a robust data analytics system that brings analytics not just to data scientists, but to all business users as well. It simplifies business data analytics even to non-technical users through its set of tools and features. Insights are extracted instantly by any user using self-service analytics without hard coding and aggregating modeling. Some of its top features that enable you to do so include its personalized dashboards, interactive visualizations, and analytical capabilities.
Its dashboard is one of its top features that enable you to filter, explore, and mine data in just a few clicks to get instant answers to your questions. With its in-chip technology, data analytics can be performed faster with richer insights. Furthermore, it provides you with advanced analytics through an improved, advanced BI reporting and predictive analytics by integrating R functions in your formulas.
It is best to test the features and functionalities of the tool first so that you’ll know if it matches your requirements. To do so, you may sign up for Sisense free demo.

| USER SATISFACTION | 99% |
| OUR SCORE | 9.7 |
Why choose Sisense?
- NLG technology. With NLG (Natural Language Detection) technology, you can easily detect trends and patterns when you are interacting with every single widget on the dashboard.
- Data Visualization. It has a rich widget library with a wide collection of predesigned data visualization widgets. You also have the option to submit your own open-source designs or receive recommendations on how to best view your data.
- Anomaly detection. If there are any anomalies in your data, the system uses machine learning to instantly detect and alert you with any potential issues.
Detailed Sisense Review
2. Salesforce Analytics Cloud

Salesforce Analytics Cloud is a business intelligence software powered by Einstein Analytics and Tableau. The platform’s powerful features enable organizations to explore data more efficiently and to discover new insights. In turn, these insights can help improve understanding of business data and boost the likelihood of business success.
Salesforce Analytics Cloud is designed to handle data from a wide variety of sources. The platform comes with a prebuilt connector for internal data used by your business, along with configurable connectors for external data in data warehouses and data services such as Amazon Web Services. Users can also create datasets from data in CSV files.
With all these features, Salesforce Analytics Cloud ensures that organizations have the tools they need to take full control of their business data.
Why choose Salesforce Analytics Cloud?
- Guided data exploration. The platform allows users to quickly visualize or query data through guided conversations powered by natural language technology. The automatic suggestions provided by the software are based on fields in the available datasets.
- Unique dashboards for users. The software allows users to create their own unique views of a dashboard. This feature makes it easier for users to find the data they need.
- Faster discovery of data insights. Through Salesforce Analytics Cloud, users can also create stories to discover meaningful correlations among variables in a dataset. The software helps users sift through huge amounts of data more quickly to discover these insights.
Detailed Salesforce Analytics Cloud Review
3. Qualtrics Research Core

Qualtrics Research Core is an award-winning enterprise market research platform created to help users make data-driven decisions through AI and machine learning. Used by thousands of brands and educational institutions worldwide, this platform comes equipped with tools such as survey management, data management, and statistical research. With these, you can easily perform research and development initiatives, product research, competitive benchmarketing, concept testing, and more. As such, you’ll be able to identify trends and gain actionable insights into your operations.
Aside from the abovementioned, this platform also comes with options for segmentation, targeting, and multi-channel distribution. With these, you can more efficiently organize your surveys for data collection. Qualtrics Research Core also has built-in integrations with popular platforms such as Salesforce, Marketo, Slack, and Adobe Analytics so you can easily import data for analysis. Last but not least, this platform is available for free, making it a great option for small companies and schools looking for a good solution without the hefty price tag.
Why choose Qualtrics Research Core?
- AI-powered interface. The platform has Qualtrics IQ features that leverage AI and machine learning to simplify and accelerate the research process. This allows them to create, test, as well as modify surveys more efficiently.
- Easily accessible yet secure. Qualtrics Research Core is also built to be used as a repository for your research data and reports. It is even equipped with enterprise-grade security so you can be sure your information is safe at all times.
- Streamlined data collection. It comes with multi-channel distribution options that cover emails, social media, SMS, IVR, QR codes, and websites. This makes it easy to reach your target respondents. It even consolidates all the data after so you don’t have to worry about organizing the collected data.
Detailed Qualtrics Research Core Review
4. Looker

Looker is a data analytics platform that allows anyone to ask sophisticated questions using familiar business terms. It delivers data directly to the tools and applications used by your team, including custom ones.
In simple terms, the platform gathers and extracts data from various sources and then loads it into an SQL database. From there, it undergoes the platform’s agile modeling layer for custom business logic and, finally, makes it available for all users through dashboards, shared insights, and explorations.
As a browser-based solution, data is conveniently accessible in your existing systems and easily shareable to everyone in your team. Exporting can also be done both locally and directly to platforms such as Google Drive and Dropbox. If you are interested to know this solution’s features better, the Looker free demo can be a great way to get started.
Why choose Looker?
- Accessible data. The app doesn’t lock your data in your data analytics tool. Instead, it can be accessed through systems such as Slack and Salesforce.
- Data scheduling. Anyone in the team can schedule the delivery of data to FTP, S3, chat, webhooks, and email, among others.
- Web integration. This provides you with a responsive mobile design, a solution that’s embeddable with SSO, and a full RESTful API.
Detailed Looker Review
5. Zoho Analytics

Formerly Zoho Reports, business data analytics platform Zoho Analytics hosts different components. These include KPI widgets, pivot tables, and tabular view components. Thus, it can generate reports that offer very useful insights. The system promotes collaborative review and analysis, allowing users to work with colleagues on report development and decision-making.
What’s good about the system is that businesses can embed just about any report or dashboard in their blogs, websites, and apps. The system even has state-of-the-art security practices that include connection encryption. It can also be used by ISVs and developers the solution in the building and integration of analytical and reporting functionalities into their systems. Zoho Analytics offers a free trial and test drive its features at no cost.
Why choose Zoho Analytics?
- Insightful reports. The solution makes use of a variety of components, allowing it to generate insightful reports, which can be used as a basis for data-driven decisions.
- Highly-secure system. It makes use of only the finest security measures, including encrypted connections.
- Collaboration. Zoho Analytics promotes collaboration, allowing colleagues to jointly develop reports and decisions.
Detailed Zoho Reports Review
6. Reveal
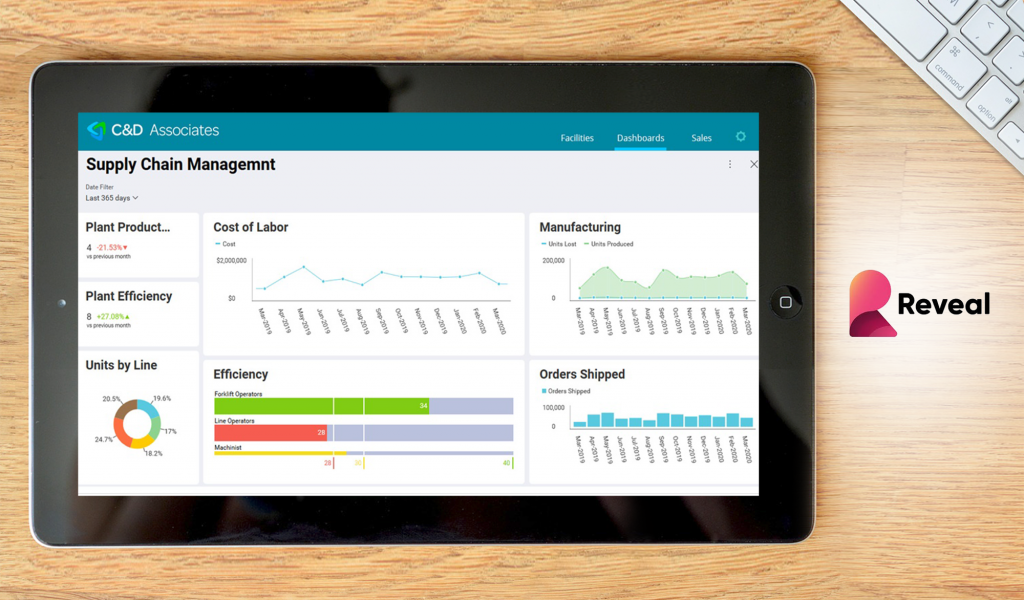
Reveal is an innovative business intelligence software built to help small, mid-sized, and large businesses adopt faster, evidence-based decision-making. Primarily, the platform is designed for businesses that want to create high-impact, expressive dashboards to maximize business insights. Its drag-and-drop interface helps users to create stunning visualizations and share them with team members and clients.
Beyond its powerful data analytics capabilities, Reveal allows you to access content anytime, anywhere, and on any device. Moreover, its simplicity and ease of use mean that anyone within your team can easily create KPI dashboards and data visualizations in minutes. For this reason, the platform helps you instill a data-driven culture within your organization. The vendor offers a comprehensive free trial to get you up to speed with the features.
Also, Reveal allows users to leverage different statistical functions including linear regression, time-series forecasting, and predictive analytics to make sense of data. Besides, they offer an embedded analytics solution at an additional cost. This lets businesses add data analytic and visualization capabilities into their on-premises and SaaS applications.
Why choose Reveal?
- Flexible architecture. With Reveal’s architecture, it’s super easy to embed analytics and makes them a seamless part of the existing applications.
- Powerful APIs. Moreover, with powerful KPIs users can integrate data analytics capabilities to their apps with ease.
- Responsive dashboards. Reveal allows you to add responsive KPIs and marketing dashboards to your applications. The dashboards look beautiful on your apps and provide a smooth scrolling experience on all devices.
Detailed Reveal Review
7. Yellowfin
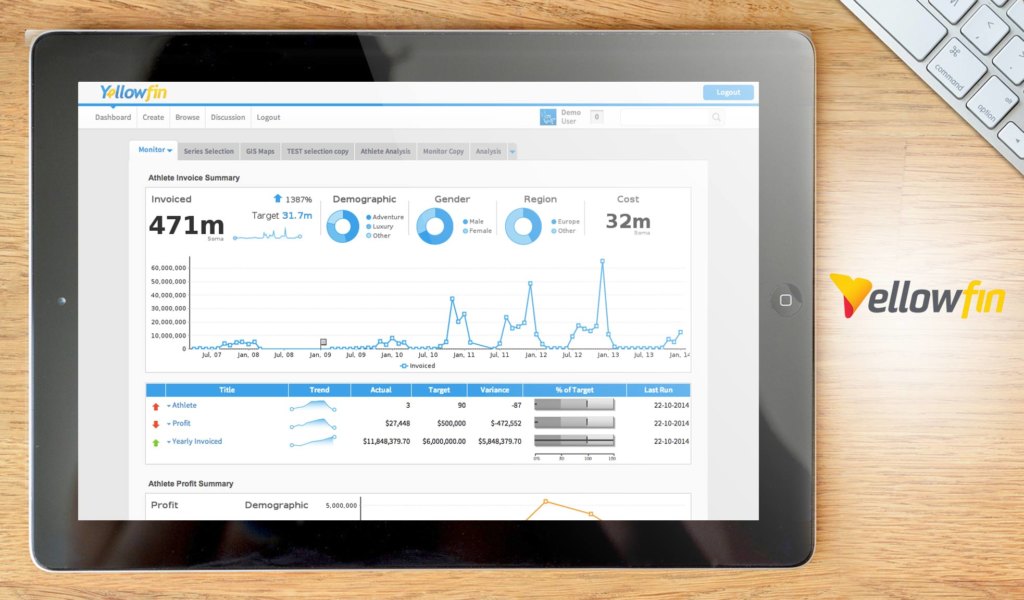
Yellowfin is an end-to-end business intelligence solution created to help companies make better sense of their data. Equipped with comprehensive analytics features, market-leading collaboration tools, and machine learning capabilities, this is great for getting actionable insights from your company’s performance. It allows you to get data-driven predictions that can be used to make smarter business decisions. The software even has multiple data visualization options so you can present your data, however you prefer.
Accessible via desktop and mobile devices, Yellowfin also comes with a web API that lets it integrate with a wide variety of business systems, add-ons, and widgets. This means you can easily extend its functionalities depending on the changing needs of your business. Alternatively, you can merge it with your existing software solutions to streamline your workflow. The vendor has an appealing free trial where you can tinker with the features at no cost.
Detailed Yellowfin Review
Why choose Yellowfin?
- Fully integrated BI platform. Yellowfin was created to eliminate having to invest in different BI solutions. With this, you can address multiple analytics problems and consolidate all of your data discovery, reporting, and analytics in one platform.
- Data storytelling. Traditional graphs and charts can be boring and difficult to understand. Using Yellowfin’s data storytelling capability, you can create interactive presentations using different immersive analytics. This way, you can simplify the data visualization process and let your numbers do the talking.
- Customizable notifications. On top of presenting you with comprehensive reports, Yellowfin also makes sure you are in-the-loop at all times. Offering custom notifications, you will be alerted whenever there are notable changes in your data flow.
8. Periscope Data

Periscope Data by Sisense combines business intelligence and analytics into a single end-to-end platform to provide modern business with a solution for collecting data, analyzing them and sharing the insights garnered to the team and their customers.
It aggregates distinct data sources into one single source of truth and then utilizes advanced analytics and BI reporting to make the most out of them. The platform offers a wide variety of visualizations and charts to choose from, and you can even create your very own if that’s the more beneficial course of action to take for your organization.
Its predictive analysis feature, together with its Natural Language Processing capability, which can streamline the analysis of unstructured data, helps keep your business competitive and proactive. Working with data is also made simpler and more efficient thanks to the integrated Python, R and SQL environments.
Detailed Periscope Data Review
Why choose Periscope Data?
- Data Engine. It comes with a data engine that lets you spend less time managing several tech stacks so that query performance is at its fastest. When paired with data ingestion at the most optimal speed, this virtually guarantees that you’ll have ample time analyzing data regardless of its complexity, size, and concurrency.
- Powerful SQL Editor. Periscope Data comes with advanced functionalities, such as autocomplete, query revision history and snippets mode. Moreover, it’s an environment that supports Python, R, and SQL. This means that preparing datasets, performing analysis and creating interactive visualizations are all easier to do in the language of your choice.
- Insights sharing. Live dashboards can be seamlessly and quickly shared with the team either using email, direct link or via Slack. This keeps everyone on the same page. Dashboards can even be embedded directly into your website or product, so end users can easily explore data whenever convenient to them.
9. Domo

Domo is a data analytics solution that aims to provide a digitally connected environment for your data, people, and systems. Your business’ data is put into work for all employees in your organization through real-time data refresh and drag-and-drop data preparation capabilities. Furthermore, partners outside of your organization also get to engage with your data to increase productivity and the ability to act on them.
Using a holistic view in your system, you can make more informed actions with the tool’s 7 platform components working together. You are notified with predictive alerts to bring crucial matters and issues into your attention with enough time before they make an impact on your organization.
Detailed Domo Review
Why choose Domo?
- Connected data. Bring your data directly together with over 500 data connectors from any third-party source such as on the cloud, on-premise, and proprietary systems.
- Instant data-driven chat. It has more than 300 interactive charts and dashboards both for desktop and mobile use.
- Native mobile apps. Manage responsibilities on your mobile devices both for Android and iOS that’s intuitive, real-time, and designed for on-the-go usage.
10. Qlik Sense

Qlik Sense is powered by the associative engine to deeply extract insights commonly missed by other query-based data analytics tools. It does so by indexing each possible relationship between data and combining them from various data sources into a centralized view. The cloud-based data analytics platform provides you with flexibility in providing the right solution for various cases for analysts, teams, and global enterprises.
The absence of pre-aggregated data from standard query-based tools paves the way for asking new questions and generating analytics even without waiting for the help of experts in building new queries. Sharing of insights is made with ease regardless of your organization’s size as the system enables work collaboration in a secure, unified hub.
Detailed Qlik Sense Review
Why choose Qlik Sense?
- Smart visualization. Find insights visually by the fully interactive interface of the platform that enables you to pan, zoom, and make selections to explore and pinpoint your data effectively.
- Interactive analysis. Interactive selection and global search let you explore data and ask any question with no limits to exploration. Each click also updates analytics instantly to ensure the most up-to-date version is available.
- Flexible for any device. Touch interaction and a responsive mobile design ensure you can work on any device once you build the analytics app once to enable exploration, collaboration, and creation of analytics.
11. GoodData

GoodData is an end-to-end, secure cloud data analytics system that caters to your entire data pipeline—from the moment you take in data to the time you deliver the insights you generated. It is not only available to enterprises, but partnerships and software companies as well. The product is mostly used in industries such as insurance, retail, financial services, and ISV.
This smart business application integrates insights directly into your point of work to expedite the decision-making process. Improvements are also automated over time as it learns from user actions and is capable of making data-driven predictions. On top of that, the tool ensures enterprise-grade security in HIPAA, GDPR, SOC II, and ISO 27001, among others.
Detailed GoodData Review
Why choose GoodData?
- Industry-specific solutions. The tool has solutions specifically built to cater to the needs of ISV, retail, financial services, and insurance industries.
- Quick implementation. Deployment is done quickly so you can immediately use the system within 8 to 10 weeks.
- Embedded analytics. Analytics is embedded in your application so you can extend it for any use case such as machine learning, benchmarking, basic reports, and advanced analytics.
12. Birst

Birst is a solution that utilizes data analytics in a network that connects your insights for making smarter business decisions. These networked analytics solutions combine the speed, agility, and usability of consumer-grade desktop tools with the needs of IT specialists for data governance and scalability. It has a multi-tenant cloud architecture that enables the expansion of data analytics across departments, product lines, and regions.
Its specialty lies in its 2-tier approach for end-user data visualization, querying, and production-oriented business intelligence. You can extract data and maximize connectivity options in various databases and cloud or on-premise applications. Developers can build their connections, or they may use its numerous integrations with third-party systems.
Detailed Birst Review
Why choose Birst?
- User data tier. This lets you enable data as a service for data governance by both centralized and decentralized teams. It is used for aggregating and governing a complex mix of enterprise data with agility and speed.
- Adaptive user experience. Users get a broad choice in how they interact with data that adapts to modern work styles. Regardless of the device used, you will see the same consistent interface with the tools that you prefer.
- Multi-tenant cloud architecture. It connects everyone in a single, networked view of data through the virtualization of the entire data analytics ecosystem.
13. IBM Analytics

IBM Analytics is a data analytics tool specializing in evidence-based insights to support crucial decision-making for your business. It simplifies how you collect, organizes and analyze your data to allow an optimized procurement, management, and scale. You even get freedom on how you collect all types of data from various data sources.
The tool also lets you build a secure foundation for your analytics and organize your data in a business-aligned, single source of truth. Furthermore, it enables you to scale your insights by incorporating evidence-based insights into your decisions that were previously unobtainable. This can help you analyze data more smartly.
Detailed IBM Business Analytics Review
Why choose IBM Analytics?
- Machine learning. Expedite the deployment of data science projects by maximizing intelligence into your enterprise application.
- Prescriptive analytics. Consider business constraints and the optimization of business trade-offs to determine the best course of action according to plan, design, schedule, and configuration.
- Predictive analytics. This brings together data mining, text analytics, predictive modeling, ad-hoc statistical analytics, and advanced analytics capabilities, among others, to spot patterns in data and anticipate what is most likely to happen next.
14. IBM Cognos

IBM Cognos is the solution to consider when you’re looking to make business decisions quickly with the use of smart self-service capabilities. This tool provides IT with a solution to deploy in the cloud or on-premise according to the architecture they require. Additionally, it caters to business users who want to create and configure dashboards and reports on their own.
One of its top features is its self-service functionality that enables users to interact and access reports on mobile devices, both online and offline. When it comes to analytics, the tool also offers a wide selection of analysis methods ranging from trend analysis, analytical reporting, trend analysis, and what-if analysis.
Detailed IBM Cognos Review
Why choose IBM Cognos?
- Smart self-service. As an integrated solution, you can efficiently deliver mission-critical analytics and generate insights from data in an impressive presentation and visualization.
- Robust automation. To increase productivity across teams, ecosystems, and organizations, it uses smart technology to automate the analytics process, offer recommendations, and predict user intent.
- Complete cloud-based experience. The user experience remains consistent whether you are using the tool via desktop or mobile device as it doesn’t require any desktop tool. This also eliminates the need for you to transfer data as it lives in the cloud.
15. IBM Watson
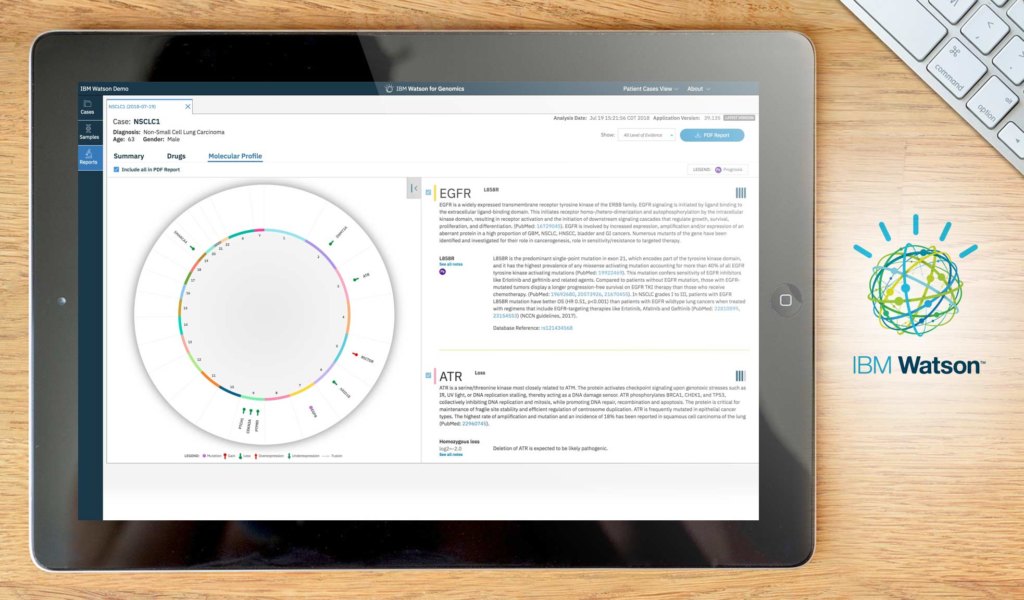
IBM Watson is an analytics platform that streamlines leveraging interactions, predicting disruptions, and accelerating research through the use of artificial intelligence. This advanced data analysis and visualization solution lives in the cloud and provides a reliable guide to users over the discovery and analysis of their data.
Independently unravel patterns and meaning in your data through guided data discovery and automated predictive analytics. Even without the help of a professional data analyst, you can interact with data and gather answers that you can understand using the tool’s cognitive capabilities like natural language dialogue. This means any business user can immediately determine a trend and visualize the data report in the dashboard for an effective presentation.
Why choose IBM Watson?
- Smart data discovery. Using your own words, you can easily type a question that will add or connect to data for you to gather understandable insights on the go. Whether you’re on desktop or iPad, you immediately get a roster of starting points.
- Analysis of trusted data. Since data analytics comes in many forms, the tool helps you stay in synch when exploring, predicting, and assembling data for a trusted insight.
- Simplified analysis. You can be prepared to act with confidence when you identify patterns and factors that can potentially drive business outcomes.
16. MATLAB

MATLAB is a data analytics platform commonly used by engineering, and IT teams to support their big data analytics processes. It enables you to access data from various sources and formats such as IoT devices, OPC servers, File I/O, databases, data warehouses, and distributed file systems (Hadoop) in a single, integrated environment.
Before the development of predictive models, the system empowers you to preprocess and prepare your data by automating tasks ranging from cleaning data, handling missing data, and removing noise from sensor data. You can then directly forecast and predict outcomes by building predictive models and prototypes. Furthermore, the system lets you integrate the tool with production IT environments even without recoding or building a custom infrastructure.
Detailed MATLAB Review
Why choose MATLAB?
- Machine learning. Offering a full set of statistics and ML functionalities, it provides you with advanced methods like system identification, prebuilt algorithms, financial modeling, and nonlinear optimization.
- Online deployment. The tool integrates with enterprise systems, clouds, and clusters. Additionally, it can be targeted for real-time embedded hardware.
- Physical-world data. It provides native support for binary, image, sensor, telemetry, video, and other real-time formats.
17. Google Analytics

Google Analytics is one of the most popular and widely-used data analytics tools to summarize data on high-level dashboards and function with a variety of funnel visualization techniques. At its core, it is a web analytics service that is used for tracking and reporting about website traffic. The freemium product provides an analysis of poorly performing pages using various data-driven techniques.
Furthermore, this tool provides you with data that you can transform into actionable insights for businesses of all sizes to garner a stronger result across their websites, applications, and offline channels. Specializing in one of the most important aspects of data analysis, this tool is essential for building a tight data analysis framework for your organization.
Detailed Google Analytics Review
Why choose Google Analytics?
- Data collection and management. You get a single, comprehensive view of your customer that’s easily customizable according to your business needs. Sharing this across your organization is streamlined as well.
- Data activation. Used in marketing, data can be activated to leverage marketing campaigns and explore new content and channels.
- Data analysis. Reporting and analysis tools are available to help you segment and filter data according to your needs to have a better understanding of your customer’s lifecycle.
18. Apache Hadoop

If you are looking for an open-source platform, Apache Hadoop is a good place to start for distributed storage and processing of large datasets. In addition, it offers services for data access, governance, security, and operations. It is a collection of utilities that facilitates a network of multiple computers and data sets on computer clusters built from commodity hardware to solve problems.
This solution is fundamentally resilient to support large computing clusters. Failure of individual nodes in the cluster is rarely an issue, and if it does, the system automatically re-replicates the data and redirects the remaining ones in the cluster. It is a highly scalable platform that stores, handles, and analyzes data at a petabyte scale.
Detailed Apache Hadoop Review
Why choose Apache Hadoop?
- Low cost. Since it is an open-source platform, it runs on low-cost commodity hardware, making it a more affordable solution compared to proprietary software.
- Flexible platform. Data can be stored in any format, parsed, and applied the schema to it when read. Since structured schemas are not required before storing data, you may even store data in semi-structured and unstructured formats.
- Data access and analysis. Data analysts have the option to choose their preferred tools as they can interact with data in the platform seamlessly using batch or interactive SQL or low-latency access with NoSQL.
19. Apache Spark

Apache Spark is a developer-friendly big data analytics platform that supports large SQL, stream processing, and batch processing. Like Apache Hadoop, it is an open-source platform in data processing that supports a unified analytics engine for machine learning and big data.
To maximize this solution, you can run it on Hadoop to create applications that will leverage its power, derive deeper insights, and improve data science workloads in a single and shared database.
Consistent levels of response and service are expected with its Hadoop YARN-based architecture which makes the tool one of the data access engines that work in YARN in HDP. This means the solution, along with other applications, can share a common dataset and cluster with ease.
Detailed Apache Spark Review
Why choose Apache Spark?
- Unified solution. It caters to creating and combining complex workflows as it comes packaged with support for SQL queries, graph processing, machine learning, and higher-level libraries.
- Data processing engine. Data analysts can execute streaming, machine learning, and SQL workloads in development APIs needing fast access to datasets.
- Easy-to-use APIs. The tool is easy to use as it offers a collection of over 100 operators for data transformation and familiar data frame APIs for semi-structured data manipulation.
20. SAP Business Intelligence Platform

SAP Business Intelligence Platform is a data analytics tool for monitoring key metrics and gaining valuable insight into customer behavior while eliminating the guesswork in the process. At its core, it serves as a BI solution for delivering actionable information at your reach. It is available both in the cloud or on-premise to suit your requirements.
The platform offers various tools, including SAP Analytics Cloud and SAP BusinessObjects BI Suite. They are used for solving specific business needs and leveraging decision-making. By supporting the collecting IQ of your business, this tool is reliable in providing a high standard for enterprise data analytics and BI.
Detailed SAP Business Intelligence Platform Review
Why choose the SAP Business Intelligence Platform?
- Dashboards and apps. Dashboards are compelling and insightful to drive an effective BI adoption to your organization.
- Data Visualization. To present the data in a way that’s understandable for everyone involved, the tool helps business users in various skill levels to easily understand and make use of data when making business decisions.
- Self-service. By having access to data anytime and anywhere, decision-making is made faster and more informed through real-time business data.
Other Recommended Solutions
- Actian. This platform features data management, analytics database solution and data integration that let you process queries of various data types, such as, SQL, embedded, relational, object and NoSQL. Moreover, it integrates with a variety of apps and databases in both on-premise and cloud deployment model and is ideal for large and medium enterprises.
- Analyse-it. An Excel-based data visualization and statistical analysis tool, this software suits users who are familiar or comfortable with spreadsheets. Also, non-technical users with limited statistics skills will also find it intuitive, especially that file formats are saved as an Excel workbook, making collaboration simple.
- Pyramid Analytics. A user-friendly high-end analytics platform, this comes with a self-service BI portal. Furthermore, it is also compatible with any browser or device and features tools to generate various data modeling that helps you understand complex business issues.
- Arcadia Data. A BI platform with real-time capabilities that can scale to a variety of data modeling demands, Arcadia Data is an ideal tool to help you understand complex statistics fast. Additionally, the system has a strong orientation towards data security and aims to set the standard on preventing data leaks.
- SigmaPlot. A data analysis tool to help you create graphs fast, even for non-technical users. Besides, this software can also integrate with Excel for data organization and PowerPoint for presenting outputs.
- dxFeed Bookmap. A revolutionary data visualization solution, dxFeed Bookmap provides users with a crystal clear view of the market to equip them with essential data to make smarter business decisions. In addition, the platform is primarily designed for traders who are looking to track the dynamics of Depth of Market and explore the evolution of the order book.
- AtomLynx Insights Engine. This business intelligence solution and data analytics platform gathers all important metrics and information from disparate sources and places them on a single platform for fast and efficient data analysis. Moreover, it leverages AI to provide you with the relevant metrics you need.
- Displayr. An intuitive BI system for beginners yet powerful for pros, Displayr features tools for visualization, exploration, modeling, and reporting. Furthermore, it utilizes drag-and-drop variable manipulation, full R Language support, and statistical testing.
- Statistix. Featuring a menu-driven interface and easy navigation for non-statisticians, Statistix features powerful data manipulation capabilities. The vendor also offers free technical support.
Maximizing Your Data Analytics Software
The process of analyzing big data to improve your business operations doesn’t stop at purchasing data analytics software. If you want to achieve your goals, you should also put some elbow grease into learning the ins and outs of your new data analytics system. Moreover, it is pertinent that you have a clearcut idea of how to use it to your advantage. To help you, we have listed some ways on how to maximize this type of technology. Alternatively, you can also check out our guide to big data analytics to get started.
1. Define what you want to achieve using data analytics
Even before purchasing your data analytics program, try to list down what you plan to use it for. That is to say, you need to understand what aspects of your operations will benefit from using data, specify the type of insights you would want the platform to provide, and determine what you want to measure. By doing so, you will be able to specify your KPIs and other metrics as well as establish a good framework as to how you can use your new investment.
2. Determine where to source your data
Most analytics platforms have the capability to source data from multiple internal and external systems for a more convenient data collection and synchronization process. However, this doesn’t mean you should simply integrate your platform with all your existing business systems and call it a day. Be selective about where you source your data, choosing only those that will help you move your data analysis efforts forward. This way, you not only generate more targeted reports but also prevent your database from being cluttered with information that you won’t even use.
3. Regularly Assess Your Data Models
You wouldn’t use outdated information to perform analysis, so why should you utilize outdated data models? To prevent old data models from having a negative effect on your data analytics efforts, you need to make it a point to assess these models now and then. Check if you are ignoring certain data sources or if you have overlooked how certain fields could affect your model. Perhaps, certain data sources are containing poor naming standards that are affecting your data analytics model. By taking this extra step, you can ensure that you are generating accurate reports that can drive your business forward.
By taking advantage of these tips as you implement your data analytics software, you are only a few steps away from reaping all the benefits that this technology has to offer. Hopefully, our list of 20 best data analytics tools was able to guide you in finding the right platform for your operations.
To sum it up, we highly recommend choosing Sisense. This is because it offers a low-code business intelligence system that is great for both tech-averse and tech-savvy users. Furthermore, it offers highly customizable dashboards, allowing it to easily adapt to your business’ data analytics and visualization needs.
Category: B2B News