
As a result of the 2020 COVID-19 pandemic, live chat has steadily grown as one of the most preferred customer service channels. In fact, along with the phone, it is the most accessible touchpoint for customers. Based on the most relevant live chat software statistics, businesses can obtain a good range of benefits by offering good live chat support. These include increasing brand loyalty and even brand evangelization. So, having a live chat software solution is not just all bells and whistles. It is essential as you will later see.
In this article, we will explore the state of live chat in the customer service arena. Naturally, this will involve a slew of expert live chat software statistics, market projections, and other customer service tools. Of course, we will also discuss customer behaviors and preferences. In this way, you will be able to form your company’s best practices based on relevant data.

Live Chat Software Statistics Table of Contents
The Increasing Role of Live Chat in Customer Service Statistics
Customer service is a very important business function. In fact, it should be present from the get-go—from pre-sales to after-sales support. It is the function that threads through and guides customer journeys. When customer service is poor, organizations can expect unfortunate repercussions. Thus, it is very important to be on point.
The Importance of Customer Service
- The majority of consumers, at 87%, believe that brands should strive to offer a consistent customer experience. This is especially so as to more than half of them, at 54%, usually base their purchasing decisions based on their overall experience (Nuance Communications, 2020).
- 73% of customers will consider switching to a competitor just after one bad customer experience (Northridge Group, 2020)
The Growing Role of Live Chat and Messaging in Customer Service
At this point in the digital age, consumers have become more used to communicating via messaging applications. In fact, some prefer live messaging over voice calls. This has been reflected in customer service in live chat software statistics on usage.
- The use of voice in customer service has decreased from 2015 to 2020, from 51% to 43% (Aspect, Conversion Research, 2020).
- A significant 64% of customers tried a new customer service channel in 2020 (Zendesk, 2021).
- When it comes to customer preference, both voice and live chat support are favored by 64% of all consumers (The Northridge Group, 2020).
- Also, during COVID-stricken 2020, 74% of customers who have messaged companies for the first time intend to continue doing so (Zendesk, 2021).
- A significant 41% of customers prefer live chat over other channels. Unfortunately, an estimated 42% of businesses believe that customers prefer phone interactions (Kayako, 2021).
- Companies, in 2020, have increased their use of live chat channels with web messaging use expanding by 29% and in-app messaging by 27% (Zendesk, 2021).
- However, the use of other messaging channels has also increased. These include WhatsApp (62%), Facebook Messenger (51%), and SMS/texting (47%) (Zendesk, 2021).
Customers Expect Business to Have Live Chat Support
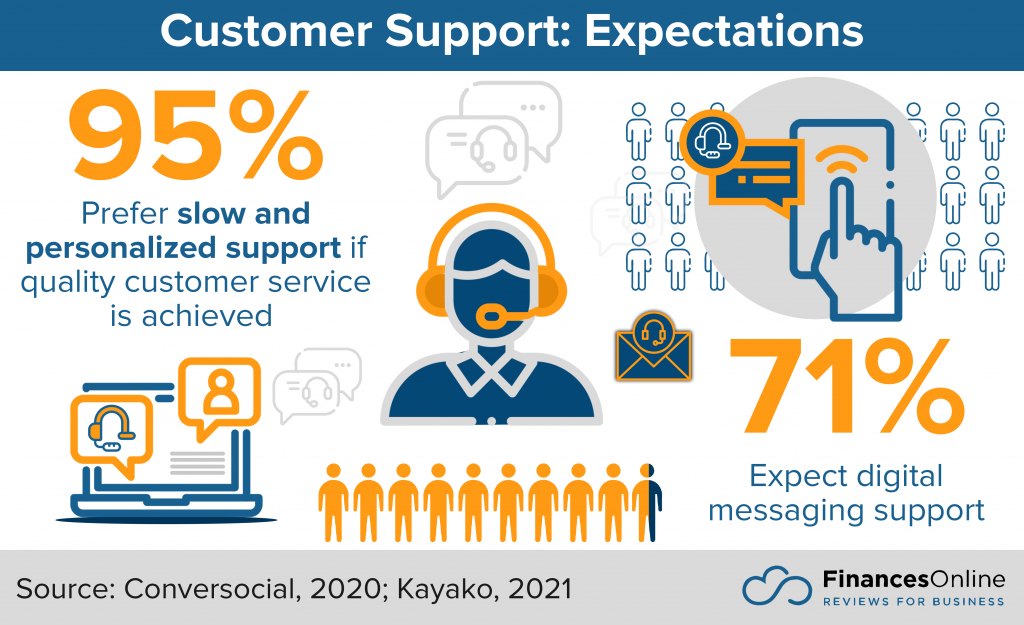
- Recently, it was found that 71% of customers expect brands to provide customer support through digital messaging platforms (Conversocial, 2020).
- Moreover, 95% of consumers would rather want slow and personalized live chat support if this guarantees a better quality of customer service experience (Kayako, 2021).
Top Three Product Categories Where Customer Service Matters Most (EY, 2020)
- 66% – Appliances and Technology
- 57% – Beauty and Cosmetics
- 50% – Apparel
Customer Live Chat Support Preferences
Increasingly, customers are preferring to use live chat and messaging applications to contact a business. It was found that 75% of people aged 18 to 24 prefer to message businesses using their website or mobile app and social messaging applications. The share of such in people aged 25 to 39 is 81%. Here are the preferences of different age groups and their breakdowns (Zendesk, 2021).
18 to 24
- 40% – via website or mobile app
- 35% – social messaging app
- 21% – SMS/texting
25 to 39
- 42% – via website or mobile app
- 39% – social messaging app
- 17% – SMS/texting
40 to 54
- 47% – via website or mobile app
- 31% – social messaging app
- 20% – SMS/texting
55 and above
- 48% – via website or mobile app
- 24% – social messaging app
- 22% – SMS/texting
More Customers are on Mobile
- In 2020, there was an estimated number of 5.19 billion mobile phone users. This figure saw a 2.4% increase from the previous year (We Are Social & Hootsuite, 2020).
- Moreover, mobile phones now account for 50.1% of the time people spend online (We Are Social & Hootsuite, 2020).
- There were 167.77 million mobile US buyers in 2020. This number is expected to reach around 187.5 million by 2024. (eMarketer, 2020)
- In fact, it was found that chat applications have an 89% share of the total mobile app usage (We Are Social & Hootsuite, 2020).
Live Chat Support on Mobile
- Before the pandemic in 2019, 74.5% of live chats were done on mobile devices. This is already a staggering increase of 82% from the previous year (Comm100, 2020).
- When it comes to customer support in the recreation industry, it was found that 76.5% of live chats were done on mobile (Comm100, 2020).
- In the services industry, 71% of live chats were on mobile (Comm100, 2020).
- The technology industry received the lowest share of live chats request on mobile at only 24% (Comm100, 2020).
- During the same year, it was found that only 0.54% of companies did not offer mobile chat (Comm100, 2020).
Given these live chat statistics 2021 and those found in the midst of COVID-stricken 2020, one must recognize the fact that customers are increasingly on mobile. They no longer use only use their phones for productivity and recreation, they also use them to seek customer service and support for brands more regularly. Also, most consumers prefer contacting businesses via their own website or mobile app. Thus, it is imperative to provide some sort of customer support on those platforms. Moreover, strengthening your customer support presence on social media is also good business practice.
Source: Zendesk, 2021
COVID-19 and Emerging Customer Behaviors Statistics
The COVID-19 pandemic was surely a curveball. Nobody (except for a few) expected it to be on a global scale with far-reaching effects. The pandemic has pushed both the public and private sectors to adapt quickly and effectively. And this affects customer service practices in a wide range of industries. These include adopting various tools for businesses and customers to keep in contact with each other.
The Market Is Now More Online Than Ever
- 60% of customers increased their online shopping during the pandemic (The Northridge Group, 2020).
- 8% of people who shopped online during the pandemic were first-time online shoppers (The Northridge Group, 2020).
- Only 32% of customers did not increase or decrease their online shopping during the pandemic (The Northridge Group, 2020).
- 81% of business leaders think that customers will try and use digital apps. A good 63% of customers actually did during the pandemic (The Northridge Group, 2020).
- There was a 30% increase in the use of online chat for customer service (The Northridge Group, 2020).
- The preference for digital channels has increased by 14 percentage points from 2015’s 24% to 2020’s 38% (The Northridge Group, 2020).
With these increases, bottlenecks in customer service became common. And, as live chat software statistics have shown, customer service representatives had more difficult times resolving customer issues.
Customer Service Bottleneck
- First contact resolution dropped to 42% in pandemic-stricken 2020 from the 53% rate reported in 2019 (The Northbridge Group, 2020).
- The volume of customer service tickets in North America during the pandemic was 16% higher compared to pre-pandemic levels. (Zendesk, 2020)
- Average monthly live chats increased by 23% from April to August 2020 compared to January to March 2020. (Comm100, 2020)
- Live chat agents each had to handle an average of additional 18% sessions during the onset of the pandemic. (Comm100, 2020)
- Many industries experienced an increase in mobile chats received from April to August 2020 compared to January to March 2020: travel (+16%), healthcare (+6%), business services (+4%), telecoms (+5%), recreation (+1%), and real estate (+1%). (Comm100, 2020)
- A study revealed that phone customer service representatives who had to work from home found it difficult to provide optimal customer service due to insufficient infrastructure. Hold times and escalations increased by around 34% and 68%, respectively, within just two weeks after COVID-19 was declared a pandemic. (Dixon et al., 2020)
- The percentage of calls handled during the onset of the pandemic rated as “difficult” more than doubled from the usual 10% to more than 20%. (Dixon et al., 2020)

Given these, we can safely recommend that businesses should ramp up their customer service and support on all of their channels (not just live chat) if they want to earn better scores in live chat statistics 2022 reports this coming year.
Live Chat Software Market Statistics
As live chat support demand has been increasing, the live chat software market is also expected to grow together with other customer service platforms. By 2027, the total market size for such software solutions is expected to reach nearly $1 billion.
- The live chat software market in pandemic-stricken 2020 was estimated to have reached $683.4 million (Global Industry Analysts, 2021).
- The global live chat software market size is projected to reach $997 million by 2023. (Allied Market Research, 2020)
- By 2027, the market is projected to grow at a CAGR of 5.6% from 2020 and hit $999.2 million (Global Industry Analysts, 2021).
- The US live chat software market in 2020 has been estimated to have reached $201.5 million (Global Industry Analysts, 2021).
- From 2020 to 2027, China’s live chat software market is projected to grow at a CAGR of 5.7% and reach a market size of $176.1 million (Global Industry Analysts, 2021).
- In the same period, other markets are also expected to register decent CAGRs. These include Japan (5.3%), Canada (4.5%), and Germany (4.6%) (Global Industry Analysts, 2021).
The Rising Demand for Customer Service Software in General
- In 2015, the CRM software market revenue only reached a little north of $24 million. In 2019, it reached $42.7 million. That is a 77.9% growth. (Pang et al., 2021)
- In 2021, it was estimated to have reached $43 million. (Pang et al., 2021)
- By 2024, it was expected to reach more than $43.5 million. (Pang et al., 2021)
- Together with other adjunct software, including marketing and sales applications, CRM and customer service software revenue is likely to reach $91.7 billion by 2024. (Statista, 2021)
- The United States is likely to account for a little more than 50% of the revenue with a projected figure north of $46 million. (Statista, 2021)
Top Messaging Channels Used by Companies by Growth (Zendesk, 2021)
These are fueled by the growing use of messaging channels by companies and customers alike. This is why you will see growth in the use of both “free” applications and premium ones like web and in-app messaging tools. Moreover, a near 50% growth in the use of SMS/texting has also been witnessed.
- 62% – WhatsApp
- 51% – Facebook Messenger
- 47% – SMS/Texting
- 29% – Web Messaging
- 27% – In-App
The number of live chat software providers has also been increasing. However, there are a few that dominate the category. These include tawk.to, Facebook Customer Chat Plugin, and Zendesk.
Top Live Chat Software Market Shares in 2021 (Datanyze, 2021)
- 40.55% – others
- 21.39% – tawk.to
- 13.66% – Facebook Customer Chat Plugin
- 11.28% – Zendesk Chat
- 6.9% – Tidio
- 6.21% – LiveChat
Source: Global Industry Analysis, 2021
Most Popular Live Chat Software
- Zendesk. Zendesk offers flexible plan structures that include chat, call center, and knowledge base solutions so all your bases are covered. Learn more about the platform by reading our Zendesk review.
- Freshchat. Freshchat lets you distribute contextual messages, capture leads, and collect customer info, all from one platform. Our Freshchat review details the benefits of using the platform.
- Salesforce Live Agent. Salesforce Live Agent can be embedded on your website and apps so your customers can reach out to you anytime. Get more details on the software by checking out our Salesforce Live Agent review.
- Zoho SalesIQ. Zoho SalesIQ allows you to not only provide live chat support but to also collect information on website visitors. Check out our Zoho SalesIQ review to find out more about the platform’s features.
- LiveChat. LiveChat offers chat and help desk features, along with tools for sales, marketing, and web analytics. Find out more about the platform through our LiveChat review.
Global Live Chat Support Performance and Satisfaction Statistics
As mentioned, live chat support is getting more important in today’s business climate. And, businesses that provide quick and quality customer support are more likely to thrive than those that don’t. In fact, having good live chat support can bring great benefits to a company.
Importance of Live Chat to Businesses: Key Benefits
- 79% of companies say that live chat has had a positive impact on customer loyalty, sales, and revenue (Kayako, 2021).
- 38% of consumers will more likely buy from a business that offers live chat support (Kayako, 2021).
- 51% of customers are more likely to stick with or purchase again from a business that provides live chat support (Kayako, 2021).
- In addition, 94% of customers also say brands that deliver satisfying customer experience over messaging platforms are more likely to have repeat purchases (Conversocial, 2020).
- Indeed, 63% of consumers who spend $250 to $500 per month online are more likely to buy from and remain loyal to a business that offers live chat support (Kayako, 2021).
Comparing Performance: Pre-COVID vs. COVID-Era
Arguably, before the general adoption of messaging channels, customer service performance and satisfaction can be expected to be better. However, as live chat statistics, 2021 will attest, the satisfaction level has increased from previous years.
Pre-Pandemic Performance
- In 2019, the global customer satisfaction rate with live chat usage was highest in the real estate industry (98.56%), followed by transportation (90.86%), technology (90.13%), business services (89.47%), and education (88.69%). (Comm100, 2020)
COVID Era Live Chat Satisfaction Statistics
- Around the world, the customer satisfaction rate of live chat usage has increased since 2017 by five percentage points. This is since a large dip from 2015’s 85.4% (Comm100, 2021). In 2017, the customer satisfaction rate was 80.6%, which went back up to 85.6% in 2021, just 0.2% above 2015’s figure (Comm100, 2021)
- The statistical trend is also mirrored in the global contact center satisfaction index, especially in the private sector. In 2016 and 2017, the index score was only 68. Then, the next year, it rose to 70. But, in 2019, it went back to 68 again. In 2020, however, the index score reached 71 (CFI Group, 2020).
- The story is different though when it comes to contact center satisfaction in the government sector. From 2017 to 2018, the sector received a score of 68. This then dropped to 63 the next year. In 2020, it rose slightly to 64 (CFI Group, 2020).
As this performance and satisfaction in the use of live chat software statistics have shown, customer service during the pandemic and in 2021 has bounced back from a terrible performance in previous years. However, the same factors, more or less, affect customer satisfaction.
Top 5 Negative Customer Service Experiences (The Northridge Group, 2020)
- 73% – long wait time to reach an agent
- 69% – trouble finding answers on the company website
- 67% – difficulty navigating the phone system or unable to get a live person
- 66% – difficulty accessing live/human customer support
- 60% – asked to repeat information over and over again
Live Chat Customer Service Performance
As seen, the top negative customer service experience as per the majority of customers is the long wait time to reach an agent. In this regard, some industries fare better than others. In fact, just in the pre-pandemic performance, the real estate industry is still on top as you will see on the industry performance on the use of live chat software statistics later below.
- It takes an average of 52 seconds for agents to respond to a customer question on live chat (LiveChat, 2021).
- The average wait time, once a live chat session has been initiated, is 2 minutes and 40 seconds (MacDonald, 2021).
- On average, it takes live chat agents 11 minutes and 34 seconds to comprehensively resolve a customer case (99Firms, 2020).
- Teams with over 50 live chat agents had the highest satisfaction rate (88%). They also had the lowest number of chat sessions per agent (Comm100, 2020).
- Unfortunately, 21% of companies failed to respond to live chat requests (MacDonald, 2021).
- 43% of businesses know that the user experience they offer is not good enough (Kayako, 2021).
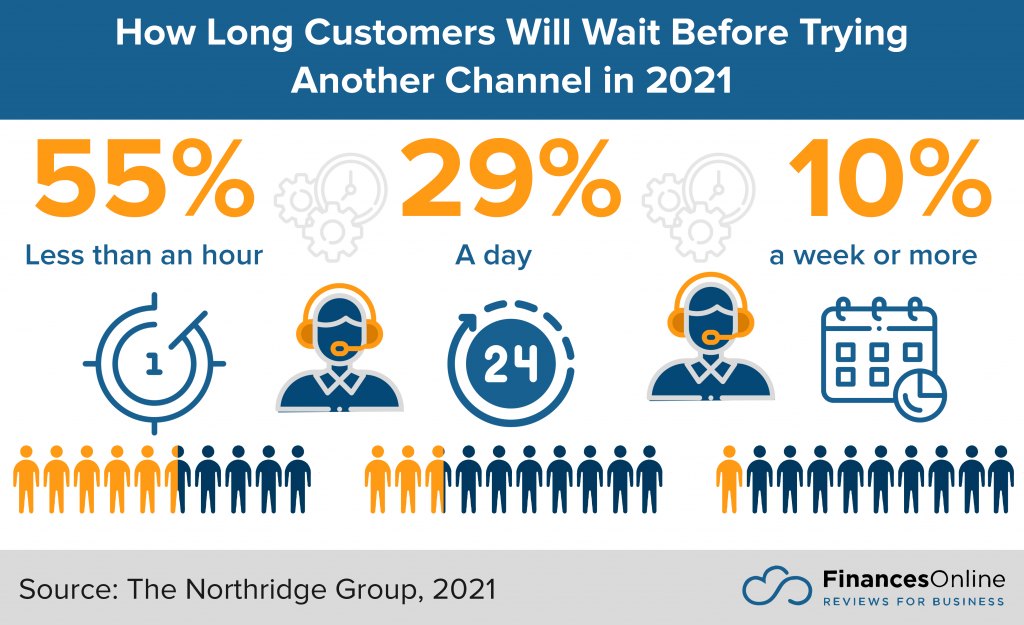
How Long Customers Wait Before Trying Another Channel (The Northridge Group, 2021)
- 55% – less than an hour
- 29% – a day
- 10% – a week or more
- 6% – would not use another channel
Industry Live Chat Support Wait Times (Comm100, 2021)
- 0 – Real Estate
- 6 – Healthcare
- 10 – Consumer Products and Services
- 10 – Retail/eCommerce
- 24 – Government and Non-Profit
- 24 – Manufacturing
- 29 – Entertainment
- 36 – Banking and Finance
- 42 – Telecommunications
- 44 – Business Service
- 50 – Travel
- 53 – Transportation
- 70 – Education
- 88 – Technology
Speed of Resolution of Online Chat Customer Service Requests
- 42% – within minutes
- 31% – within an hour
- 26% – a day or more
Key Factors of Live Chat Customer Service Success Statistics
Just as the top negative customer service experience remains more or less the same, the key factors for success are also largely unchanged. The top key factor for customers is the ease of resolution. This is, in other terms, the minimization of customer effort. Although this quite covers a wide array of customer service aspects like having a public knowledge base, it is also useful in more active channels like live chat and phone.
The Top Factors that Impact Customer Satisfaction (NTT)
- 70.7% – Ease of Resolution (Customer Effort)
- 52.5% – Agent Knowledge
- 42.8% – Ease of Contact (Choice/Accessibility)
- 40.5% – Time Taken to Resolve Queries
- 23.9% – Organizational Policies
- 22% – Same Issues Occur Repeatedly, feedback goes unanswered
- 16.2% – Digital Channel / function doesn’t work
- 10.8% – Preferred Channel Not Available
- 9.2% – Cant trust services will be delivered
- 5.9% – Other
- 3.6% – Difficult to speak with a human
Asymmetric Priorities: Business vs. Consumers
However, there is a potentially large problem. According to recent records in live chat software statistics preferences, businesses and consumers may have different priorities in terms of how to improve customer service (The Northridge Group, 2020).
Top Business Live Chat Customer Service Priorities
- Consistent omnichannel experience
- Personalized service
- 24/7 customer service, reducing wait times
Top Customer Live Chat Customer Service Priorities
- Speed to issue resolution
- Accesibility of service
- Knowledgeable service teams
Top Factors Affecting Customer Service Satisfaction
Source: NTT
Designed byThe Future of Live Chat Statistics: Human vs. AI?
Currently, there has been increasing use of chatbots and AI in customer service, especially in live chat support. Recent chatbot statistics prove this rise in adoption. In fact, the market for chatbots is expected to grow at a compound annual growth rate (CAGR) of more than 30% from 2020 to 2025.
- The chatbot market is expected to reach $102.29 billion by 2025 from $17.17 billion in 2019, at a CAGR of 34.75% over the forecast period 2020 – 2025. (Mordor Intelligence, 2020)
This is because using such software is touted to help make chat support efficient, especially the use of chatbots in ecommerce industry. Consumers, as you can see, are also warming up to the use of chatbots and AI in customer service. However, there are also pushbacks.
Consumers’ Openness to AI and Chatbots
- A more recent report found that 41% of consumers believe chatbots and AI can potentially enhance their customer experience. 59% think otherwise. (Conversocial, 2020)
- 40% of businesses in the United States, Europe, and China leveraged chatbots and virtual agents as of 2020. (Press, 2020)
- 69% of consumers prefer using chatbots as they allow for more efficient communication with brands. (Mordor Intelligence, 2020)
- 71% of consumers would gladly use a chatbot if it means improving their customer experience. (Conversocial, 2020)
- Retail companies that use chatbots are seen by customers as efficient (47%), innovative (40%), and helpful (36%). (Peart, 2020)
- Despite the rise of chatbots, 70% of consumers still prefer human agents to AI technologies. (99Firms, 2020)
The use of automation, in general, has more often led to higher efficiency. However, the human component is always present. Maybe, it won’t be at the frontlines or at the dirty side of the job. But, it is always there to guide and check how the system is working overall and maybe step in when automation solutions cannot handle the issues. This, we shall predict, would be the case in customer service.
In fact, humans and AI will not “fight” over jobs. But, just like other technological augmentation invented, chatbots will serve as tools. To use an anthromorphism, humans and AI will work together.
Most Helpful Things About Chatbots (Zendesk, 2021)
- 29% – get answers outside business hours
- 27% – get faster replies
- 19% – get an accurate answer
- 18% – none of the above
- 7% – don’t need to talk to a human
Most Frustrating Things About Chatbots (Zendesk, 2021)
- 43% – can’t get an accurate answer
- 31% – start over when getting a human agent
- 23% – can’t get through a human
- 3% – none of the above
Preferences: Which functions are best done with a chatbot or a human?
However, the divide is fuzzy. Not everything is black and white. Each consumer does not have to belong to an exclusive category. The use of live chat software statistics shows that some prefer to accomplish some things using either medium (human or AI). For instance, a significant share of consumers would like to file complaints to a person rather than a chatbot.
Source: Zendesk, 2021
Here is a breakdown of these preferences (Zendesk, 2021):
Preferences for Automated Interactions
- 41% – tracking an order
- 32% – checking a status or balance
- 22% – changing an order
- 22% – none; I don’t want an automated transaction
- 21% – return or exchange
- 19% – requesting a quote
- 19% – asking for technical support
- 18% – billing or payment question
- 17% – filing a complaint
- 6% – none of the above
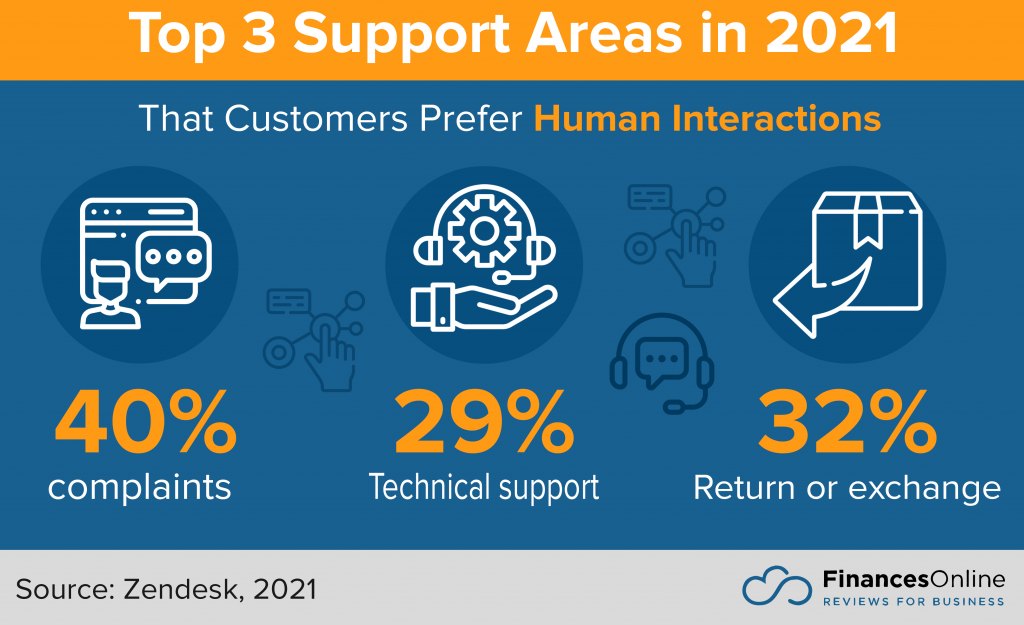
Preferences for Human Interactions
- 40% – filing a complaint
- 40% – asking for technical support
- 32% – return or exchange
- 31% – billing or payment question
- 27% – changing an order
- 23% – requesting a quote
- 20% – all of the above
- 13% – tracking an order
- 13% – checking a status or balance
- 6% – none; I don’t want a human interaction
As you can see, consumers would rather have an automated interaction to resolve easy queries quickly. These include order tracking or checking the status or balance of something. On the other hand, in general, customers would rather let humans handle complex issues like technical support or filing a complaint. You can use this as a rule of thumb when setting up a hybrid chat support system involving both humans and AI.
Aligning Priorities
As these live chat statistics 2022 edition show, there are gaps between businesses and customers. And, this is the default case or the natural state of affairs. Both sides try to manage and influence each other’s expectations and, therefore, the things they feel and think they require from each other. The problem, however, is this will be intractable when both parties do not see eye to eye. No useful progress can be achieved without having a common ground.
It is imperative, therefore, for businesses to understand the side of the customers. This includes the things they value and expect at certain junctures in their customer journeys. Likewise, a good amount of analytics is in order. To do the best you can, you might need standalone business intelligence software. However, if you want to just focus on customer behaviors in live chat room statistics, then the top live chat software tools may be enough.
Usually, they are fitted with analytics tools that can help you gauge performance and usage. Moreover, the best of them also have tools for projections. Hence, you can be able to make more data-driven decisions. More importantly, you can have a glimpse of what the pain points are and prioritize the most crucial ones. Taking care of the gaps in priority and expectation is the first step to improving your customer service.
Then you can design a live chat strategy and practices to proactively take care of your customers along each juncture of their customer journeys.
References:
- 99firms. (2021, August 20). Live chat statistics. 99firms – Discover The World’s Best Service & Software Providers. 99firms.
- Allied Market Research. (2020, July 27). Live chat software market to reach $997 million by 2023. GlobalNewswire.
- Aspect. (2020). Consumer Index Report 2020. Aspect.
- CFI Group. (2020). Contact center satisfaction index (CCSI) 2020. CFI.
- Comm100. (2020). Live chat benchmark report 2020. Comm100.
- Comm100. (2021). Live chat benchmark report 2021. Comm100.
- Conversocial. (2020). The state of customer experience trends report 2020. Conversocial.
- Datanyze. (2021). Market share of leading live chats technologies worldwide in 2021. Statista.
- Dixon, M., McKenna, T., & De la O, G. (2020, April 8). Supporting customer service through the coronavirus crisis. Harvard Business Review.
- eMarketer. (2020). eMarketer snapshot: US commerce 2020. Insider Intelligence.
- EY. (2020, October 22). Global: Share of shoppers that valued customer service 2020. Statista.
- Global Industry Analysts. (2021, April). Live chat software. MarketResearch.com.
- Kayako. (2021). Live chat statistics. Kayako.
- LiveChat. (2021). Interactive 2021 customer service report. LiveChat.
- MacDonald, S. (2021, May 4). 25 reasons live chat can help you grow your business in 2021. SuperOffice.
- Mordor Intelligence. (2021). Chatbot market – growth, trends, COVID-19 impact, and forecasts (2022 – 2027). Mordor Intelligence.
- The Northridge Group. (2020). State of customer service experience 2020. The Northridge Group.
- NTT. (2019). Global customer experience benchmarking 2019. NTT.
- Nuance Communications. (2020). Powering the future of intelligent customer engagement. Nuance.
- Pang, A., Markovski, M., & Markovska, A. (2020, November 4). Top 10 CRM software vendors, market size and market forecast 2019-2024. Apps Run The World.
- Peart, A. (2020, May 19). Chatbot statistics: 2020 and beyond. LinkedIn.
- Press, G. (2021, January 1). AI stats news: Only 14.6% of firms have deployed AI capabilities in production. Forbes.
- Statista. (2021). Customer relationship management software. Statista.
- We Are Social, & Hootsuite. (2020). Digital 2020: Global digital overview. DataReportal.
- Zendesk. (2021). Customer service gets conversational. Zendesk.


Leave a comment!