
A new version of this article, featuring the latest data and statistics, is available. Check out our report on Shopping Cart Abandonment Statistics for 2022.
Even before the pandemic, the last few years have seen the downfall of some of the most illustrious names in retail. Most of it is attributed to the emergence of online shopping in general and ecommerce in particular. Even so, not all is rosy in the online shopping and ecommerce scene. Just like their physical store counterparts, online stores and ecommerce have to contend with abandoned carts, to the tune of $4.6 trillion dollars in the latest accounting. Additionally, various think tanks put the shopping cart abandonment average at a range of 60 to 80%, not so spectacular when more than half of heart and effort is lost in the online shopper journey.
The pandemic has added to the woes of physical retail, but not as much to online sellers, as this 2020/2021 report shows. This guide is aimed to help you collate all the essential data in one place as you craft a strategy to, at the least, minimize shopping cart abandonment rate versus last year.

Shopping Cart Abandonment Statistics Table of Contents
1. Value of Abandoned Cart Statistics
With trillions at stake, research on shopping cart abandonment is getting the attention of various think tanks all over the world. Most likely you will find the results in some online shopping statistics and the like. No matter the source, they reveal staggering numbers in terms of lost opportunities. Worse, they are not beyond help in minimizing the lost opportunities depicted below.
- Globally, around $4.6 trillion worth of merchandise is abandoned annually. (99firms, 2021)
- Checkout optimization can recover $260 billion in ecommerce sales. (99firms, 2021)
- 18 billion – value lost by ecommerce per year. (Dynamic Yield)
- 65% of cart abandonment translates to a 97.9% conversion gap. (Swoop)

It’s not like these online retailers do not have the tools to reveal important insights about their operations. Most should be using business intelligence tools, which are capable of revealing those pieces of information.
2. Breakdown of Abandoned Cart Statistics
There are many ways to look at the whos, whats, whys and hows of shopping cart abandonment. Most of these try to hunt down the average shopping cart abandonment rate. Of course, you cannot do anything with things that you cannot measure. With specific numbers, you can trace them down to the minutest of details and try to see how to address the critical ones. Ecommerce statistics also report shopping cart abandonment numbers, giving businesses more ways to prescribe medicine to a common diagnosis.
2020 Global Average Shopping Cart Abandonment Rate
- In March 2020, an average of 88.05% of online shopping carts was abandoned. (SaleCycle, 2020)
- For its part, Invesp puts the global shopping cart abandonment rate at 65.23%. (Invesp, 2020)
- The automotive industry has the highest online shopping cart abandonment rate at 96.88%. (SaleCycle, 2020)
- Of the 20 industries examined in selected countries, insurance has the lowest shopping cart abandonment at a rate of 67.92% only. (SaleCycle, 2020)
2018 Global Average Shopping Cart Abandonment Rate
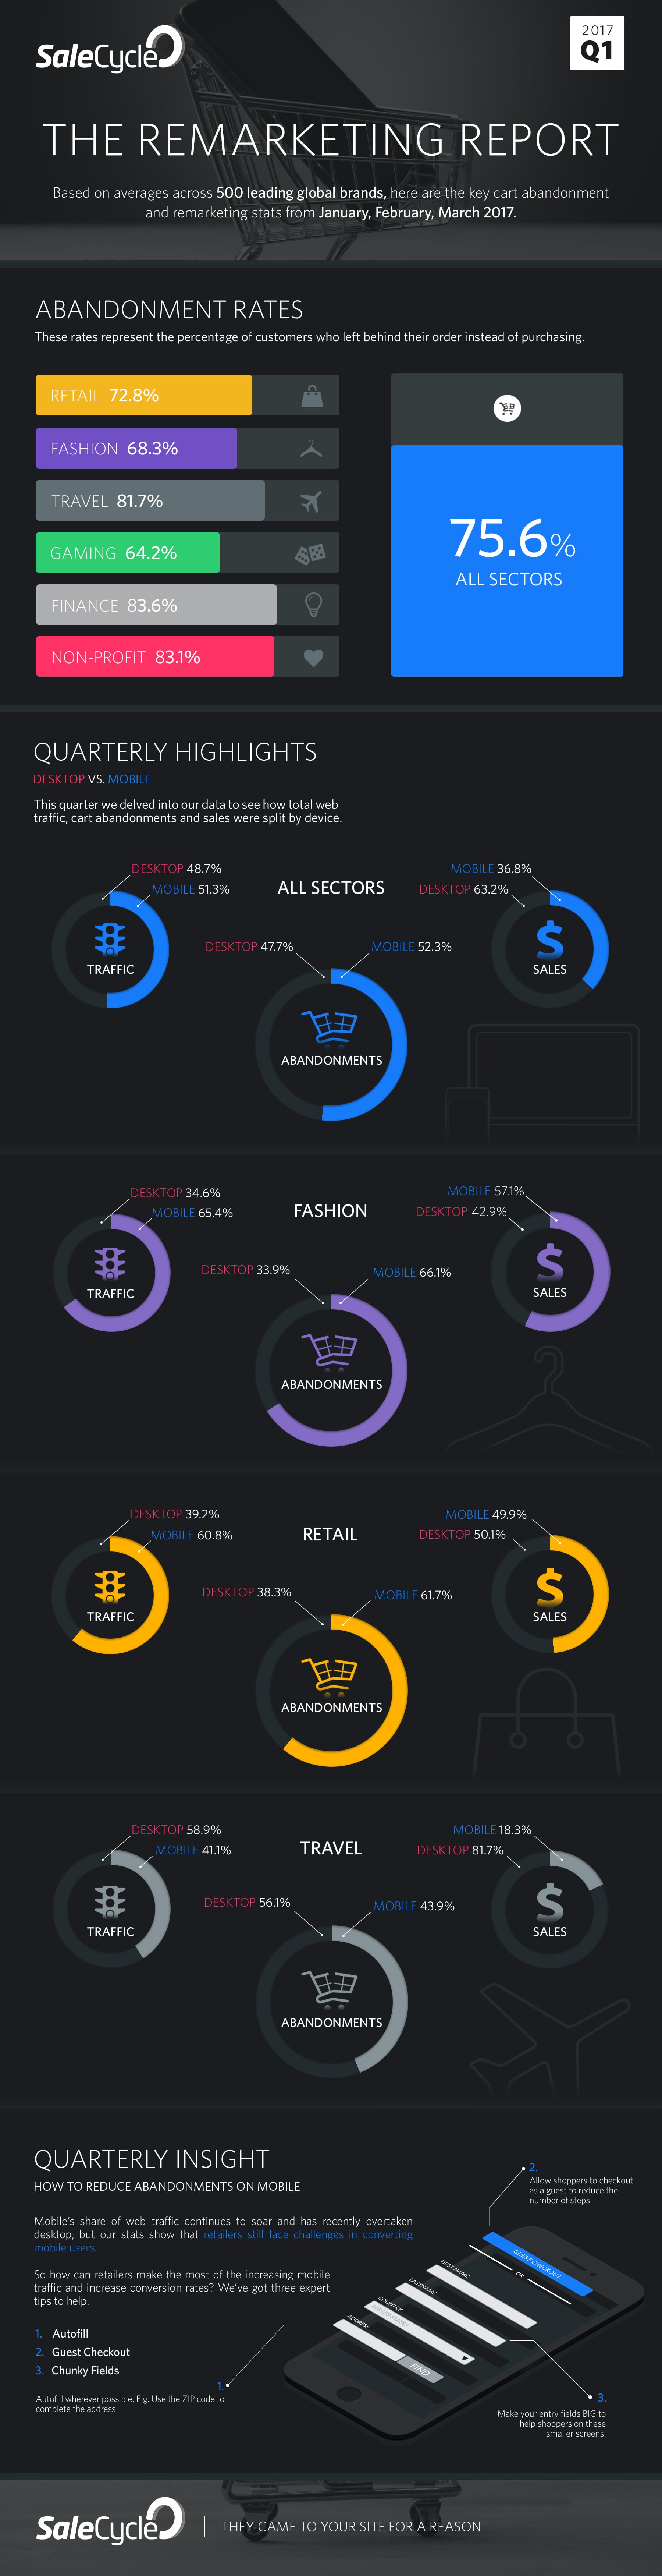
- 75.6% – the world average cart abandonment rate according to SaleCycle
- 56.8% – the world average cart abandonment rate according to Fresh Relevance
2017 Global Average Cart Abandonment Rate
- 81.4% – the world average cart abandonment rate in 2017 according to AbandonAid
- 76.9% – the world average cart abandonment rate in 2017 according to SaleCycle
Regional Breakdown
With online selling giant names like Alibaba, Baidu and Taobao, it does not require rocket science to see why China is leading the world in ecommerce. Add to that a population representing around 20% of the global total (The Atlantic) and everything just falls into place for this country. It’s also one of the reasons cart abandonment in Asia and the Pacific is the highest in the world (CreditDonkey, 2019).
- 76.3% – the cart abandonment rate in Asia and the Pacific Islands (APAC)
- 76.1% – the cart abandonment rate in the Middle East
- 75.3% – the cart abandonment rate in Latin America
- 74% – the cart abandonment rate in North America (US & Canada)
- 70.9% – the cart abandonment rate in Europe, the lowest for all regions
Industry Cart Abandonment Rates
Industries with long consideration cycles (the time you spent leading to buying) show higher rates of cart abandonment. The buyer could browse or research all they want, make a shortlist, then buy from another vendor that pops up at the last minute with the lowest price. As of March 2020, these are the top six industries with the highest cart abandonment rates (SaleCycle, 2020):
- 96.88% – the cart abandonment rate in the Automotive industry
- 94.36% – the cart abandonment rate in Baby & Child
- 92.61% – the cart abandonment rate in Luxury
- 92.04% – the cart abandonment rate in Car Rental
- 90.91% – the cart abandonment rate in Airlines
- 90.68% – the cart abandonment rate in the Fashion industry
Cart Abandonment Rates by Product Types
Some product types tend to be abandoned at the cart more than others. Even small online or brick-and-mortar stores could reproduce their own local sales statistics. With the results, they should be able to tell which items sell under certain climates or occasions, for example. Or how gender affects the cart abandonment decision (Barclaycard).
- 29% – the cart abandonment rate for women’s clothing.
- 26% – the cart abandonment rate for men’s clothing.
- 26% – the cart abandonment rate for entertainment items.
Day and Time Determines Cart Abandonment
- 90% – weekend cart abandonment rate. (Formisimo)
- 89% – Thursday cart abandonment rate. (EYStudios)
- 85% – Wednesday cart abandonment rate. (EYStudios)
- 1:00 PM to 2:00 PM, 6:00 – 9:00 PM – times when cart abandonment rate is highest. (EYStudios)
- December is the month with the highest shopping cart abandonment, followed by November. (Barclaycard)
Age Group Abandonment Rate (ContentSquare)
- 81% – rate that US consumers aged 18–65 had abandoned carts at least once in their lifetime
- 21% – rate of cart abandonment for age group 25–34
- 20% – rate of cart abandonment for age group 35–44
- 13% – rate of cart abandonment for age group 45–54
- The items they tend to abandon are clothing (40%), tech products (18%) and homeware (16%).
Rate of Cart Abandonment by Devices (Barilliance, 2020)
- 85.65% – average cart abandonment rate on mobile phones
- 80.4% – average cart abandonment rate on tablets
- 73% – average cart abandonment rate on desktops
Conversion Rate by Major Websites (CreditDonkey, 2019)
- 2.9% – AOL
- 2.6% – Yahoo
- 2.4% – Bing
- 1.9% – Google. Also responsible for 71.2 of all eCommerce site organic traffic
- 1.2% – Facebook
- 0.5% – Twitter
Source: SaleCycle, 2020
Leading Shopping Cart Software
- Wix. This popular platform lets you create websites that reflect your branding while integrating shopping cart and ecommerce. Find out more in this Wix review.
- X-Cart. Your ecommerce business can find success with this powerful shopping cart solution. You can find details about it in our X-Cart review.
- BigCommerce. More than just a shopping cart application, this robust ecommerce offering gives you full control over your online store. Our BigCommerce review examines its tools and features.
- Shopify. With this site, you do not have to worry about the technicalities and focus on your store instead. Learn what this shopping cart and webshop solution offers in our Shopify review.
- 3dcart. Customizable shops and shopping carts are only a few of the features of this platform. You can discover more in this 3dcart review.
3. Causes of Abandoned Cart Statistics
Delving into the reasons why shoppers abandon their carts is the most crucial aspect of shopping cart abandonment research. Thus far, the usual suspects emerge: steep shipping costs, unreasonable prices, and hidden costs. More revealing is how shoppers have used peer reviews to guide their buy decisions. That and how easily they can be exasperated by filling out lengthy forms and having to go through elaborate registration first. The lesson is clear: it pays to invest in reputable survey software and get them in the attention of your customers.
Customers and Sites
- 92% of people who visit online stores will not make a purchase. (Cision)
- 92% of consumers abandon carts because of negative peer reviews. They also detect fake reviews easily. (EYStudios)
- 80% – shoppers who abandon carts because of the lack of a good return policy. (Baymard Institute, 2020)
- 75% – increase in card abandonment rate due to slow-loading sites. (Baymard Institute, 2020)
- 55% – customer bounce rate because of hidden extra costs. (Baymard Institute, 2020)
- 8% of customers cited that additional taxes were the reason they dropped their shopping carts. (Invesp, 2020)
- 35% – rate of dropped online transactions because of required registration prompt. (Baymard Institute, 2020)
- 35% – buyers who abandon sites that are not secure. (Baymard Institute, 2020)
- 27% – customers who leave because of overly complicated checkout process. (Baymard Institute, 2020)
- Even the most optimized checkout process has an abandonment rate of 20%. (TechJury, 2020)
- When the checkout process is improved, eCommerce sites can experience a 35.26% average increase in conversion. (Fundera, 2020)
- Businesses can recover $260 billion in lost revenue just by making their checkout design better. (Fundera, 2020)
- 25% – shoppers who abandon their cart when the prices of products are too much. (Annex Cloud)
- 16% of people will leave the cart if the indicated delivery times are slow. (Baymard Institute, 2020)
- 7% – rate of drop conversion because of a 1-second delay in page load. (EYStudios)
- Shopping cart abandonment can occur for any number of reasons such as expensive shipping costs. However, 40% of customers admitted that they abandoned their shopping carts because they were only window shopping online. (Annex Cloud, 2020)
- Similarly, 41% of online shoppers did not push through with their purchases because they were not ready. (Invesp, 2020)
- 44% of French consumers in France said that the main reason they did not complete their purchases was due to high shipping costs. (E-commerce Nation, 2020)
- 40% of consumers in Mexico have the same reason as French shoppers for abandoning their shopping carts: high shipping costs. (AMIPCI & comScore, 2020)

Having slow sites is an anomaly in this age of fast internet. This is especially crucial when you are selling items and services online. Customers simply have little patience if you can’t be bothered to invest in dedicated server hosting solutions.
Steps, Flows, Elements, Fields
- 5 checkout steps – the average number of steps in a checkout, which is too many; the ideal is 3. (EYStudios)
- The ideal checkout flow has 12 to 14 form elements. (Fundera, 2020)
- But the average checkout flow in U.S. online shops has 23.48 form elements. (Fundera, 2020)
- There are 14 fields on average on shopping carts. The ideal is 7. (Lean CX)
- Poor mobile integration – only 4.6% add to cart on mobile compared to 8% on desktop. Mobile conversions average 2.1% compared to 2.8% on desktop. (EYStudios)
Still struggling to make heads or tails over the figures? Don’t fret now, let the best forms automation software solutions help you out.
4. Solutions to Abandoned Cart Statistics
Solutions to cart abandonment range from cart email and marketing email, pop-up windows to retargeted ads. Here you will see the success rate of each approach. You may then set your own strategies based on the numbers.
- Shopping cart abandoners are rated as 6.5 out of 10 in terms of importance to ecommerce marketing strategy. (Multichannel Merchant)
- 61.8% of the same survey respondents said they target cart recovery emails at cart abandoners. (Multichannel Merchant)
- Online shopping sites can increase their conversion rates by 45% if they enable shoppers to checkout items as guests. (Fundera, 2020)
- Retargeted ads (60%), pop-up windows (36.4%) and live chat (42.4%) are the top 3 ways respondents market to shopping cart abandoners. (Multichannel Merchant)
- 4.64% – conversion rate of abandoned cart emails. (Oberlo)
- With regard to cart abandonment emails, only 45% are opened. (Moosend, 2020)
- Of those, 21% is clicked on and 50% eventually completed their purchase. (Moosend, 2020)
- 56.84% – average open rate of recovery emails for non-profits. (99firms, 2021)
- 10.7% of received emails for abandoned cart lead to shopping cart recovery. (Annex Cloud, 2020)
- 28.3% of all ecommerce revenue comes from successful abandoned cart emails. (SaleCycle)
- Retargeting ads are 76% more likely to get clicks than regular display ads. (99firms, 2021)
- Retargeted ads have 10x the CTR of a standard display ad. (99firms, 2021)
- Use autofill function, allow guest checkout and enlarge entry fields are the best methods to reduce cart abandonment on mobile. (Smart Insights)
- 0.17% – conversion rate of a promotional newsletter. (Oberlo)
- B2C marketers who utilize marketing automation solutions and similar strategies with regard to cart abandonment, lead nurturing, and others, report a 50% increase in their conversion rates. (Moosend, 2020)
Top 3 Solutions to Abandoned Shopping Carts
Source: Multichannel Merchant
Designed byHow do I stop shopping cart abandonment?
These shopping cart abandonment statistics essentially cover everything you have to know about this modern commerce enigma. If you read the lines carefully, you should be able to adopt some best practices to avoid the worst numbers befalling your online store business.
First, there is the matter of speed. Ensure that your site is on par with the best sites out there serving millions of shoppers monthly using reliable shopping cart software. Slow simply would not cut it. If you cannot provide the speed that shoppers expect, they’ll show you speed by clicking on another vendor fast.
Second, don’t mistake your online store for a slum book. Don’t push your buyers to register elaborate information first when there are proven ways to go around it.
Finally, be vigilant and make it a habit to stay abreast of everything having to do with ecommerce, online shopping, payment gateway software solutions and the like. As the lifeblood of this nascent but tremendously dynamic industry, the success of your business essentially hinges on them.
References:
- 99firms (2021). Shopping Cart Abandonment Stats. Retrieved from 99firms
- AbandonAid (n.d.). Prevent cart abandonment!. Retrieved from AbandonAid
- AMIPCI & comScore (2019). Estudio sobre Comercio Electrónico en México 2019. Retrieved from IRP-CDN
- Barclaycard (n.d.). Retailers losing out on £18bn each year through ‘Surf and Turf’ online shopping trend. Retrieved from Barclaycard
- Baymard Institute (2020). 44 Cart Abandonment Rate Statistics. Retrieved from Baymard Institute
- Charlton, G. (2018). [Infographic] The Remarketing Report – Q1 2018. Retrieved from SaleCycle
- Charlton, G. (2021). How Coronavirus is Affecting Ecommerce: Stats. Retrieved from SaleCycle
- CreditDonkey (2019). Shopping Cart Abandonment Statistics. Retrieved from CreditDonkey
- E-commerce Nation (2020). Infographie : services logistiques, les attentes des Français en 2021. Retrieved from E-commerce Nation
- EYStudios (2016). 2016 State of eCommerce: Cart Abandonment and Recapture Statistics [Infographic]. Retrieved from EYStudios
- Formisimo (n.d.). Formisimo is now called Zuko. Retrieved from Formisimo
- Forte, D. (n.d.). How to Have a Seamless Experience In the Shopping Cart . Retrieved from Multichannel Merchant
- Fox, M. (n.d.). Shopping Cart Abandonment: An $18 Billion Opportunity (New Ebook). Retrieved from Dynamic Yield
- Invesp (2020). Shopping Cart Abandonment Rate Statistics [Infographic]. Retrieved from Invesp
- Lean CX (2017). Lean CX Infographic – The Ideal Shopping Cart Experience. Retrieved from Lean CX
- Miller, G. (2020). 31 Shopping Cart Abandonment Statistics For 2021. Retrieved from Annex Cloud
- Moosend (2021). Shopping Cart Abandonment Stats You’ll Need for 2021. Retrieved from Moosend
- Oberlo (n.d.). ABANDONED CART EMAILS. Retrieved from Oberlo
- Serrano, S. (2021). Complete List of Cart Abandonment Statistics: 2006-2021. Retrieved from Barilliance
- Shepherd, M. (2020). Ecommerce Shopping Cart Abandonment Statistics (2021). Retrieved from Fundera
- Swoop (2018). Shopping Cart Abandonment: 10 Ways to Retain Customers. Retrieved from Swoop
- TechJury (2020). 45 Shopping Cart Abandonment Stats that Will Boost Your Sales in 2020. Retrieved from TechJury
- Ward, B. (2016). [Infographic] The Remarketing Report – Q4 2016. Retrieved from SaleCycle


Leave a comment!