
A new version of this article, featuring the latest data and statistics, is available. Check out our report on Live Chat Software Statistics for 2022.
Live Chat is no longer just “nice to have.” This support channel started as an alternative to email and phone, but lately, the use of live chat in customer support has been snowballing. The proliferation of live chat in recent years has been astounding, with numerous businesses adopting this support channel to meet the growing demands of their modern customers. If you plan to invest in a new live chat software or maximize its ROI to your business, you must have an in-depth understanding of this space. We have compiled some of the most critical live chat software trends and statistics to abbreviate your decision-making process.

Live Chat Statistics Table of Contents
Live Chat Adoption Statistics
Live chat was not the customer support channel of choice initially, but in the last decade, live chat has wrestled competition from phone and email to claim the top spot, and its growth is not letting up any time soon. An in-depth look into the live chat usage statistics reveals some glowing trends. The usage of live chat apps may vary based on the company and industry. Some companies even use live chat to improve their sales organization. However, any business, regardless of its size, sector, or market, can reap significant benefits by implementing live chat.
- The global live chat software market size is projected to reach $997 million by 2023. (Allied Market Research, 2020)
- A whopping 56% of organizations adopted live chat when they had less than 100 customers. Additionally, 74% of organizations implemented live chat when they had less than ten employees. (Zoho, 2018)
- Even more, 25% of businesses adopted live chat when they were less than one year old, while 30% of organizations implemented live chat when they were more than ten years old. (Zoho, 2018)
- 85% of businesses in the B2B sector and 74% in the B2C industry use live chat for sales. (Zoho, 2018)
- 67% of companies in the B2C sector and 66% in the B2B sector use live chat for customer support. (Zoho, 2018)
- 54% of businesses in the B2B sector and 31% in the B2C sector use live chat for marketing. (Zoho, 2018)
- Meanwhile, more recent data shows that live chat has helped increase revenues of travel and hospitality companies by $16 million. (Nuance Communications, 2019)
- Live chat has also helped insurance companies save $1 million in 90 days from call deflection. (Nuance Communications, 2019)
- 38% of companies struggle to provide excellent customer service because of the lack of cross-department collaboration. (Conversocial, 2019)
- A shocking 26% of businesses feel that they are not prepared to offer live chat support via public social media apps. (Conversocial, 2019)
Chatbot Implementation
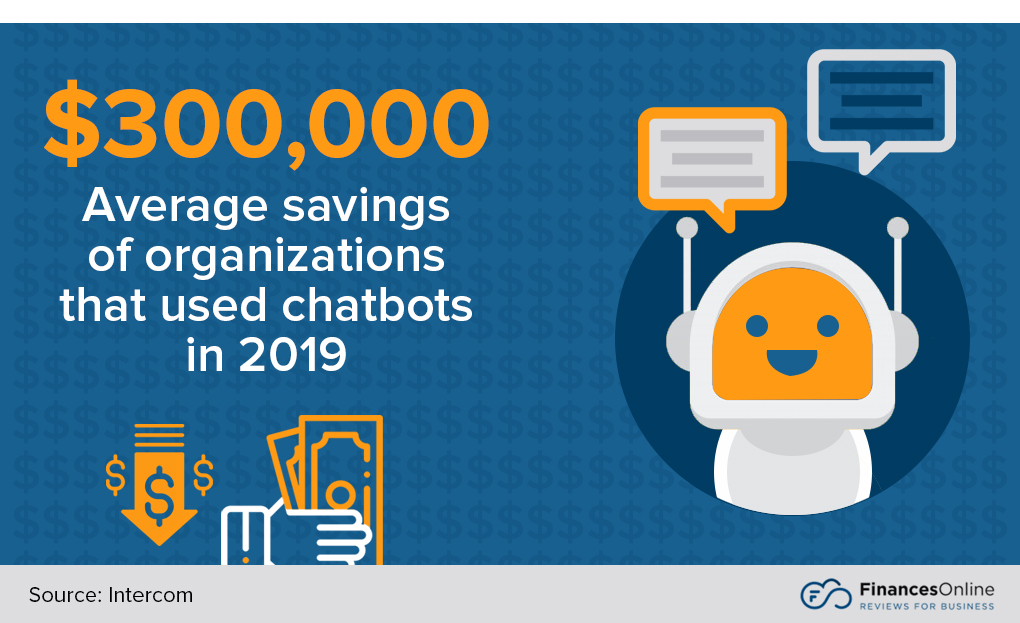
- Organizations saved an average of $300,000 in 2019 by using chatbots. (Intercom, 2019)
- Moreover, chatbots are predicted to yield $112 billion in retail sales by 2023. (Retail Dive, 2019)
- 40% of businesses in the United States, Europe, and China leverage chatbots and virtual agents as of 2020. (Forbes, 2020)
- 73% of North American businesses feel that bots and automation will be somewhat important in the near future. Also, 74% of companies in Europe feel the same way. (Conversocial, 2019)
- Some have found success with human-intermediated chatbots, Dutch airline KLM, has seen a 50% reduction in handle times because agents don’t have to type everything. (Forrester, 2019)
- However, only 14% of US online consumers expect a positive effect by interacting with chatbots, while 8% expressed that they expect a very positive interaction with them. (Nuance Communications, 2019)
- A more recent report found that 41% of consumers believe chatbots and AI can potentially enhance their customer experience. 59% think otherwise. (Conversocial, 2020)
It is vital to start using live chat when a business is young as it doesn’t just streamline conversations but also helps a company understand the preferences and needs of its customers. Live chat makes it easy to personalize the support experience, especially for customers who ask more questions or have longer research processes. By addressing customer concerns, live chat can give you leads as well. The channel also allows you to create an omnichannel window, where all customers get answers faster without being inconvenienced or feeling frustrated.
Most Popular Live Chat Software
- Zendesk. Zendesk offers flexible plan structures that include chat, call center, and knowledge base solutions so all your bases are covered. Learn more about the platform by reading our Zendesk review.
- Freshchat. Freshchat lets you distribute contextual messages, capture leads, and collect customer info, all from one platform. Our Freshchat review details the benefits of using the platform.
- Salesforce Live Agent. Salesforce Live Agent can be embedded into your website and apps so your customers can reach out to you anytime. Get more details on the software by checking out our Salesforce Live Agent review.
- Zoho SalesIQ. Zoho SalesIQ allows you to not only provide live chat support but also collect information on website visitors. Check out our Zoho SalesIQ review to find out more about the platform’s features.
- LiveChat. LiveChat offers chat and help desk features, along with tools for sales, marketing, and web analytics. Find out more about the platform through our LiveChat review.
Customer Preference Statistics
The instant communication offered by live chat has transformed the way brands interact with their customers. Live chat is no longer a cost-centered customer support channel. It has become a revenue source, an indispensable support channel that has the potential to grow a business. Because of this, many brands have already taken the lead to funnel the potential of this system.
- 41% of customers prefer using live chat, but 42% of businesses believe that customers prefer phone interactions. (Kayako, 2021)
- In 2019, the global customer satisfaction rate with live chat usage was highest in the real estate industry (98.56%), followed by transportation (90.86%), technology (90.13%), business services (89.47%), and education (88.69%). (Comm100, 2020)
- 79% of companies say that live chat has had a positive impact on customer loyalty, sales, and revenue. (Kayako, 2021)
- 38% of consumers will more likely buy from a business that offers live chat support. (Kayako, 2021)
- 51% of customers are more likely to stick with or purchase again from a business that provides live chat support. (Kayako, 2021)
- In addition, 94% of customers also say brands that deliver satisfying customer experience over messaging platforms are more likely to have repeat purchases. (Conversocial, 2020)
- People who utilize the live chat feature on a website are 85% more likely to become customers. Chatters are also bigger spenders, as they would spend 13% more than non-chatters. (Intercom, 2019)
- Indeed, 63% of consumers who spend $250 to $500 per month online are more likely to buy from and remain loyal to a business that offers live chat support. (Kayako, 2021)
- Moreover, a recent report found that 71% of customers expect brands to offer customer support through messaging platforms. (Conversocial, 2020)
Consumers’ Live Chat Experiences & Inclinations
Prefer high-quality support than speed: 95
Prefer high-quality support than speed
%Likely to repurchase from company with live chat support: 52
Likely to repurchase from company with live chat support
%Told others of positive live chat experience: 29
Told others of positive live chat experience
%Long wait times are biggest frustration: 29
Long wait times are biggest frustration
%Told others of poor live chat experience: 20
Told others of poor live chat experience
%Source: Kayako
Designed byAccording to annual studies by Comm100, there was a 3.38% decrease in customer satisfaction levels in 2017 compared to 2016. This vividly showed that having a live chat channel isn’t enough. Businesses must wield it properly to meet ever-rising customer expectations. Fortunately, businesses seem to have learned a lesson. Global customer satisfaction ratings went up from 80.68% in 2017 to 83.1% in 2018. However, 2019 showed a slightly lower average rating at 83.04%. This can be taken to mean that businesses cannot lax if they want to further maximize the benefits of live chat.
Live Chat Response Time Statistics
Let’s face it: today’s consumers hate waiting. The longer a consumer waits for an agent to become available, the more they become frustrated. And this has been the major drawback for phone and email support. Speeding up the response time means adopting an efficient customer support channel such as live chat. Numbers don’t lie; live chat is undeniably an ideally perfect channel when it comes to response times:
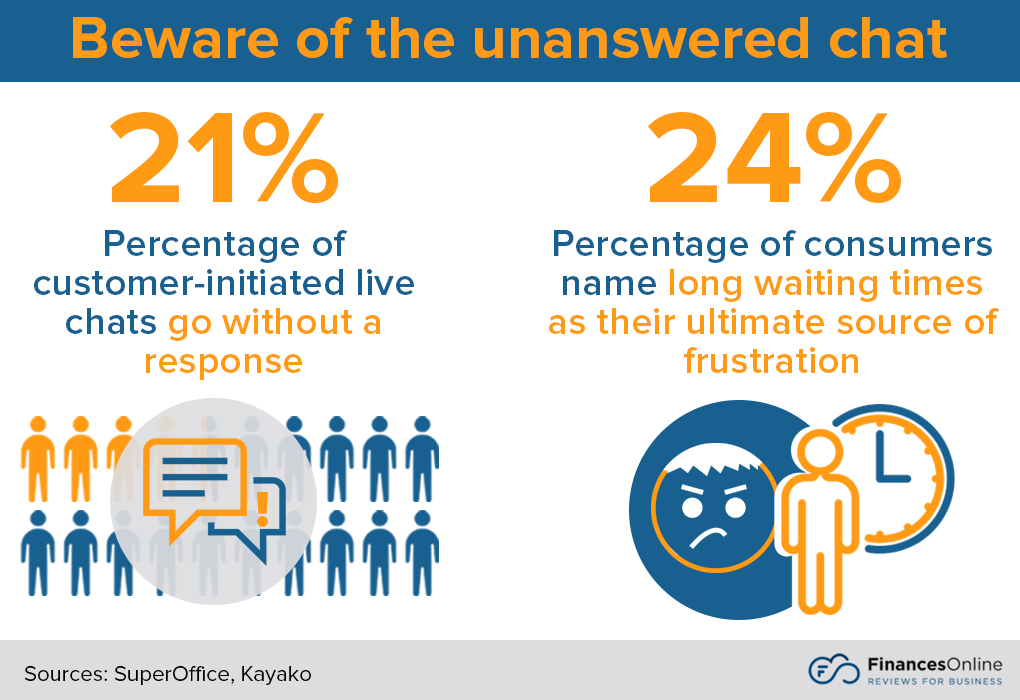
- 24% of consumers recognize long waiting times as their ultimate source of frustration. (Kayako, 2021)
- 19% of businesses have noted that their customers are frustrated by long waits. (Kayako, 2021)
- The longest consumer wait times were found to be with teams in the range of 26 to 50 agents with an average wait time of more than 80 seconds. (Comm100, 2019)
- The longest chat duration was also found with teams made up of 26 to 50 agents with an average of 13:41 per chat session. (Comm100, 2019)
- The recreation industry’s average wait time for live chat is only at 0:15, the best among other industries. (Comm100, 2019)
- According to a more recent report, it takes an average of 52 seconds for agents to respond to a customer question on live chat. (LiveChat, 2020)
- The average wait time, once a live chat session has been initiated, is 2 minutes and 40 seconds. (SuperOffice, 2021)
- On average, it takes live chat agents 11 minutes and 34 seconds to comprehensively solve a customer case. (99Firms, 2020)
- 95% of consumers prefer slow, personalized live chat support if it guarantees a higher quality of service. (Kayako, 2021)
- Interestingly, the average chat duration of organizations that got a score of 90% or higher on live chat customer satisfaction surveys is 12 minutes and 26 seconds, which is 13% longer than organizations with the lowest customer satisfaction scores. (Forbes, 2019)
- Teams with over 50 live chat agents have the highest satisfaction rate (88%). They also have the lowest number of chat sessions per agent. (Comm100, 2020)
- Unfortunately, 21% of companies fail to respond to live chat requests. (SuperOffice, 2021)
- 43% of businesses know that the user experience they offer is not good enough. (Kayako, 2021)
- 87% of consumers think that brands must put more effort into providing a consistent customer experience, especially as 54% of them commonly make purchasing decisions based on their overall experience. (Nuance Communications, 2020)
Even with the aspiration for a much lower response time, the quality of customer service should not be overlooked. Traditionally, businesses assumed that consumers only wanted instant support, but that changed. Today’s consumers are intelligent and smarter than ever; they value exceptional support over speed. The bar is high, and businesses have to find the perfect balance between faster response times and quality of service to meet the expectations of their customers.
Live Chat Mobility Statistics
There is no denying, mobile technology has been a big boon and is indispensable. This versatile technology has completely transformed how businesses interact with their customers. Today’s consumers are increasingly becoming accustomed to the mobile experience. Therefore, if you haven’t made the shift, make mobile chat more accessible and flexible.
- As of 2020, there are more than 5.19 billion mobile phone users, which is a 2.4% increase from the previous year. Furthermore, mobile phones now account for 50.1% of the time people spend online. (We Are Social, 2020)
- 74.5% of live chats were sent from mobile devices in 2019, which is an increase of 82% from 2018. (Comm100, 2020)
- Chat apps account for 89% of all mobile app usage. (We Are Social, 2020)
- Only 0.54% of companies did not offer mobile chat in 2019. (Comm100, 2020)
- There were 167.77 million mobile U.S. buyers in 2020. This number is expected to reach around 187.5 million by 2024. (eMarketer, 2020)
- 76.5% of chats were on mobile in the recreation industry. (Comm100, 2020)
- 71% of chats were on mobile in the consumer services industry. (Comm100, 2020)
- The lowest percentage of live chats received in 2019 was in the technology industry at 24%. (Comm100, 2020)
Industries with Highest Rate of Chat Queries Received via Mobile, 2019
Recreation: 76.5
Recreation
%Business Services: 73
Business Services
%Consumer Services: 71
Consumer Services
%Real Estate: 55
Real Estate
%Healthcare: 50.5
Healthcare
%Travel: 49
Travel
%Government & Organizations: 43
Government & Organizations
%eCommerce: 42
eCommerce
%Finance: 41
Finance
%Education: 37
Education
%Source: Comm100
Designed byEmerging Live Chat Technologies Statistics
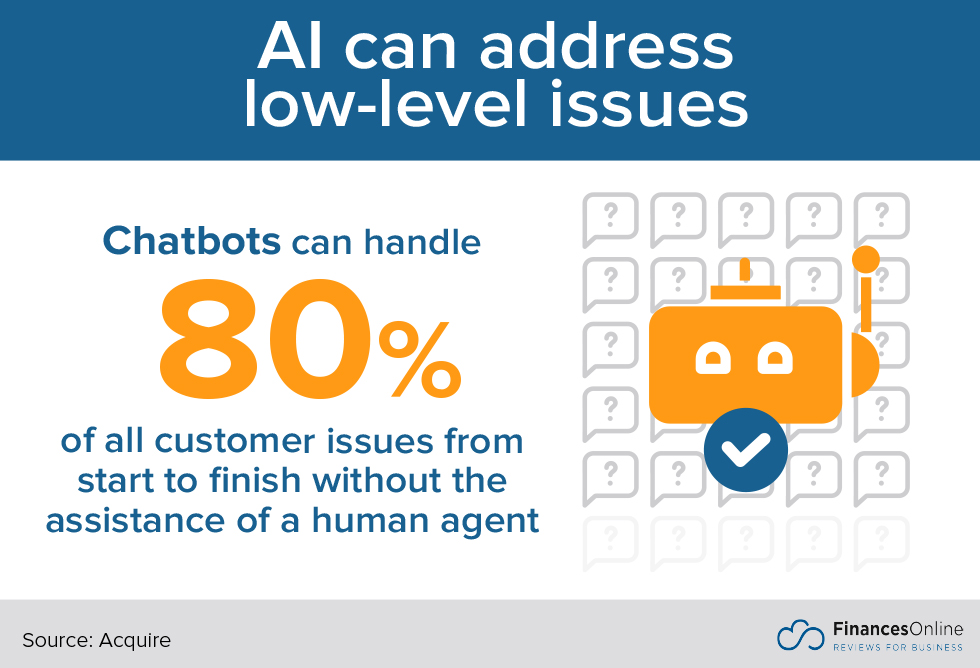
In 2017, IBM predicted that by 2020, approximately 80% of all customer service interactions would happen without the need for human agents. Reality is dawning on business owners, and it’s fascinating how fast AI has taken over the industry to become the leader in conversational computing. Additionally, comm100.com had predicted that by the end of 2018, businesses would start to enjoy the benefits of AI in live chat. And it’s already happening.
- Chatbots solved 82% of common customer queries without the assistance of a human agent. Meanwhile, when human agents worked collaboratively with chatbots, 88% of customer queries were resolved. (Acquire)
- Chatbots can handle 80% of all customer issues from start to finish without the assistance of a human agent. (Acquire)
- About 69% of organizations use canned responses in live chat sessions. (Forbes, 2019)
- 69% of consumers prefer using chatbots as they allow for more efficient communication with brands. (Mordor Intelligence, 2020)
- 71% of consumers would gladly use a chatbot if it means improving their customer experience. (Conversocial, 2020)
- Retail companies that use chatbots are seen by customers as efficient (47%), innovative (40%), and helpful (36%). (LinkedIn, 2020)
- The chatbot market is expected to reach $102.29 billion by 2025 from $17.17 billion in 2019, with a CAGR of 34.75% over the forecast period 2020 – 2025. (Mordor Intelligence, 2020)
- Despite the rise of chatbots, 70% of consumers still prefer human agents to AI technologies. (99Firms, 2020)
- Proactive live chats, where an agent invites a visitor to chat, are slowly gaining traction. In 2019, more than 1 million of all completed live chats were initiated by agents. (Comm100, 2020)
- Co-browsing, where a live agent can access the customer’s browser in real-time while resolving an issue, generated customer satisfaction scores of more than 6 points above the average. (Forbes, 2019)
How COVID-19 Affected Live Chat
The COVID-19 pandemic has caused disruptions in various industries. As a result, brands were required to rapidly adapt to the sudden growth of online customer service demands. As more organizations moved toward remote and online operations, more consumers also turned to online channels when seeking assistance and information from brands and companies they do business with.
- The volume of customer service tickets in North America during the pandemic was 16% higher compared to pre-pandemic levels. (Zendesk, 2020)
- Average monthly live chats increased by 23% from April to August 2020 compared to January to March 2020. (Comm100, 2020)
- Live chat agents each had to handle an average of additional 18% sessions during the onset of the pandemic. (Comm100, 2020)
- Ecommerce customers used messaging apps such as WhatsApp (up by 352% compared to pre-pandemic levels) and SMS/text messaging (up by 102%) more than other customer service channels since the pandemic began. (Zendesk, 2021)
- Many industries experienced an increase in mobile chats received from April to August 2020 compared to January to March 2020: travel (+16%), healthcare (+6%), business services (+4%), telecoms (+5%), recreation (+1%), and real estate (+1%). (Comm100, 2020)
- Companies that leveraged live channels during the pandemic solved 32% more tickets. (Zendesk, 2021)
- A study revealed that phone customer service representatives who had to work from home found it difficult to provide optimal customer service due to insufficient infrastructure. Hold times and escalations increased by around 34% and 68%, respectively, within just two weeks after COVID-19 was declared a pandemic. (Harvard Business Review, 2020)
- The percentage of calls handled during the onset of the pandemic rated as “difficult” more than doubled from the usual 10% to more than 20%. (Harvard Business Review, 2020)
Source: Comm100
What to Do with These Numbers: Optimizing Live Chat
Live chat has proven to be the simplest, quickest, and most accessible form of customer support. And the introduction of AI chatbots has offered a cheaper alternative that reduces the burden on human agents and improves the quality of service delivery. Furthermore, since telephone customer service could prove slightly problematic while agents work from home, the incorporation of live chat customer service makes more sense as it requires less demanding infrastructure in general.
If you have a small team and want to invest in live chat, there are plenty of live chat apps for small business out there. Also, do not forget to leverage the live chat trends and statistics we have stated earlier to create a strategy that will enable you to reap maximum benefits from your live chat. There are creative ways to use live chat for marketing, while some companies have already proven that live chat sales techniques deliver more revenues.
But, remember this: regardless of how powerful your live chat channel is, you must promote it to drive its uptake. For example, your live chat channel must be visible on your website to speed up adoption by consumers. Besides, when you offer a live chat channel, customers expect you to be available 24/7. For this reason, you need to ensure that you have the right number of agents to handle customer queries expediently at all working hours (day and night).
Moreover, your live chat should be mobile-ready because, as data has shown, customers are increasingly choosing to interact with organizations via mobile devices. Therefore, do not be tempted to look at live chat as a desktop tool alone; make your live chat mobile-ready, if not mobile-first. If you want to further your research, you can read our comprehensive guide on live chat software.
References:
- 99Firms (2020). Live Chat Statistics. 99Firms
- Acquire. The Rise of chatbots in customer service & support. Acquire
- Allied Market Research (2020, July 27). Live Chat Software Market to Reach $997 Million by 2023: Allied Market Research. Allied Market Research
- Chapman, K. & Epstein, J. (2020). 2020 Live Chat Benchmark Report – Covid-19 Edition. Comm100
- Chapman, K. & Epstein, J. (2019, February 4). The Future of Live Chat in 2019. Comm100
- Comm100 (2020). Live Chat Benchmark Report 2020. Comm100
- Conversocial (2019). Customer Experience Trends for 2019: Building the Organization of the Future. Conversocial
- Conversocial (2020). The State of Customer Experience Trends Report 2020. Conversocial
- Dixon, M., McKenna, T., & de la O, G. (2020, April 8). Supporting Customer Service Through the Coronavirus Crisis. Harvard Bussiness Review
- Gingiss, D. (2019, February 20). Report: Customer Satisfaction With Live Chat Is On The Rise. Forbes
- Jacobs, I. (2019, April 17). Stop Trying To Replace Your Agents With Chatbots. Forrester
- Kayako (2021, March 12). Live Chat Statistics. Kayako
- Kemp, S. (2020, January 30). DIGITAL 2020: GLOBAL DIGITAL OVERVIEW. We are Social
- LiveChat (2020). Interactive 2020 Customer Service Report. LiveChat
- MacDonald, S. (2021, March 11). 25 REASONS LIVE CHAT CAN HELP YOU GROW YOUR BUSINESS IN 2021. SuperOffice
- MacDonald, S. (2021, January 26). NEW RESEARCH: 21% OF COMPANIES FAIL TO RESPOND TO LIVE CHAT REQUESTS. SuperOffice
- Mordor Intelligence (2020). CHATBOT MARKET – GROWTH, TRENDS, COVID-19 IMPACT, AND FORECASTS (2021 – 2026). Mordor Intelligence
- Nuance Communications (2019). Customer Engagement 2019: Trends, Predictions & Priorities. Nuance Communications
- Nuance Communications (2020). POWERING the future of intelligent customer engagement. Nuance Communications
- Nwokeabia, B. (2020, May 8). eMarketer Snapshot: US Commerce 2020. eMarketer
- Peart, A. (2020, May 19). Chatbot Statistics: 2020 & Beyond. LinkedIn
- Press, G. (2020, January 13). AI Stats News: Only 14.6% Of Firms Have Deployed AI Capabilities In Production. Forbes
- Priya, M. (2018). How to pick the best live chat software-2018. Zoho
- Smith, T. (2021, January 7). Benchmark Snapshot: Tracking the impacts of COVID-19 on CX. Zendesk
- Williams, R. (2019, May 9). Study: Chatbots to drive $112B in retail sales by 2023. Retail Dive
- Yin, S. (2019, November 18). Where chatbots are headed in 2021. Intercom


Leave a comment!