
The COVID-19 pandemic disrupted the way modern society conducts itself in both the private and public sectors. Consumers and producers found themselves looking for ways to keep in touch and keep goods and services flowing: how to keep everything afloat by staying connected. In more ways than one, people found the solutions in digital technology. In the case of businesses and public services, one of the most effective ways to do so is to use customer service software solutions.
The widespread adoption of SaaS tools, however, was not a top-down and centrally-planned phenomenon. Many times, it has been customer-initiated. Thus, as you will see on the list of customer service software statistics below, this development led to new emergent behaviors and preferences. Moreover, this made customer service more customer-centric.
In this customer services statistics 2022 article, we will not only discuss the prevailing customer behaviors and preferences but also the direction of the customer service industry moving forward. In this way, you will be able to make better data-driven decisions in your own customer service operations.

Customer Service Software Statistics Table of Contents
The State of Customer Service Statistics
It was in 1954 that Peter Drucker stated “It is the customer who determines what a business is, what it produces, and whether it will prosper.” It was the year that customer-centricity was born. It was an astute observation then. Today, it is the state of affairs. This is why quality customer service should be a core competence of any organization—private or public.
Power to the Consumers
- The share of customers in the United States who stopped doing business with a company because of poor customer service in 2020 was 40% (Aspect; Conversion Research).
- 73% of customers will consider switching to a competitor just after one bad customer experience (The Northridge Group, 2020).
Product Categories Where Customer Service Is Most Important (EY, 2020)
In his book, “Quality and Competition,” Lawrence Abbott claimed that “What people really desire are not products but satisfying experiences.” This seems to be true as one can very well argue that the use and enjoyment of a product is, in itself, an experience. How to arrive at a satisfying experience with a product and, more so, service, however, also entails interaction with the producer; from purchase to after-sales. This is where customer service can provide a positive boost to the overall experience.
Customer service software statistics, however, show that customers expect better service when shopping in some product categories than others.
- 66% – Appliances and Technology
- 57% – Beauty and Cosmetics
- 50% – Apparel
- 50% – Personal Care
- 43% – House and Household Care
- 41% – Fresh Food
- 37% – Packaged Food
- 32% – Alcoholic Beverages
- 26% – Non-Alcoholic Beverages
Industries with the Highest Customer Churn Rates (Aspect; Conversion Research)
Theodore Levitt, a famous economist, stated that “the purpose of a business is the creation and maintenance of customers.” This might just be the ultimate summation of the customer-centric business milieu. Some businesses, and even industries, just do a better job at maintaining customers than others.
- 25% – Cable
- 25% – Financial/Credit
- 24% – General Retail
- 22% – Online Retail
- 21% – Telecom/Wireless
- 18% – Travel
- 11% – Big Box Electronics
Of course, customer service is not the end-all-be-all of why churn rates are this way. There could be other factors such as a drop in product quality or, in the case of the cable industry, the whole model is being superseded. What we can’t deny, however, is that customer service is a big part of customer churn. And it also plays a big part in the retention rates of industries.
Customer Retention Rates by Industry (Statista, 2020)
- 84% – Media
- 84% – Professional Services
- 83% – Insurance
- 81% – IT
- 78% – Telecom
- 75% – Banking
- 63% – Retail
Industries with the Highest Net Promoter Scores (Satmetrix, 2021)
As customer experience becomes more crucial, business and public organizations must find ways to measure customer experience and loyalty. One of the most popular ways to do this is by using the Net Promoter Score (NPS). Without going into much detail, the score measures how much a customer is likely to recommend a business, product, or service to others. Usually, the score is expressed by numbers from -100 to 100.
- 56 – Department and Specialty Stores
- 49 – Brokerage and Investments
- 49 – Hotels
- 45 – Credit Cards
- 45 – Airlines
- 43 – Drug Stores/Pharmacies, Smartphones, Computer and Tablets
- 42 – Online Entertainment
- 41 – Auto Insurance, Software and Apps
- 40 – Online Shopping
- 39 – Life Insurance
Industries with the Worst Net Promoter Scores (Satmetrix, 2021)
- -3 – Internet Service
- -2 – Cable and Satellite TV Service
- 27 – Health Insurance, Shipping Services
- 31 – Rideshare and Food Delivery
- 32 – Travel Websites
- 34 – Cellphone Service, Banking
Bank Customer Satisfaction Worldwide in 2021 (Statista, 2021)
Banks and other financial institutions have been on the frontlines of disruption because of COVID-19. It is a good thing that banks have been very resilient. Globally in 2021, customer satisfaction on a scale from one to five has been quite high for countries like the United States, Austria, Switzerland, and the frontrunner, Indonesia.
- 4.28 – Indonesia
- 4.11 – Austria
- 4.07 – United States
- 4.07 – Switzerland
- 4.05 – South Africa
- 3.99 – India
- 3.97 – Germany
- 3.97 – Poland
- 3.96 – Saudi Arabia
- 3.95 – China
Top 10: Companies with the Best Customer Service and their 2020 Revenue (Statista, 2021)
In 2021, however, the companies with the best customer service had something to do with tech. The frontrunner is Korea’s premier ecommerce company, Coupang. Other customer service luminaries include those that are directly involved in improving customer experience, such as TTEC. Also, one of the makers of top customer service platforms, Zendesk Inc., has made it to the list.
- Coupang Inc. – $11.96B
- Teleperformance SA – $6.32B
- Amdocs Ltd. – $4.16B
- Avaya Holdings Corp. – $2.87B
- Atento SA – $1.41B
- TTEC Holdings, Inc. – $1.94B
- TELUS International (CDA), Inc. – $1.55B
- CSG Systems International, Inc. – $990.53M
- Zendesk, Inc. – $1.02B
- Startek, Inc. – $640.22M
Source: EY, 2020
The Steady Rise of Online Customer Service Channels
As mentioned, and as you have likely experienced, customer service has largely spilled over online. Many can also argue that it is mainly online, especially at the height of the pandemic. Sometimes, it is the customers who take the lead on what channel is best to keep in touch with them. Customers are also proactive in trying new service channels during the pandemic.
- A significant 64% of customers tried a new customer service channel in 2020 (Zendesk, 2021).
However, in general, the frequency of contacting customer service for any particular reason has decreased.
- A trend has arisen from 2015 to 2020. The share of customers in the US that have contacted customer service for any reason has decreased from 71% to 58% (Aspect; Conversion Research, 2020).
Also, the use of phone or voice support has also dropped even though it remained a very popular choice.
Phone/Voice Support Demand Decreasing
- The use of voice in customer service has also decreased in the same period, from 51% to 43% (Aspect, Conversion Research, 2020).
- Despite that, the phone is still the most popular customer support channel preferred by 76% of customers (CFI Group, 2020).
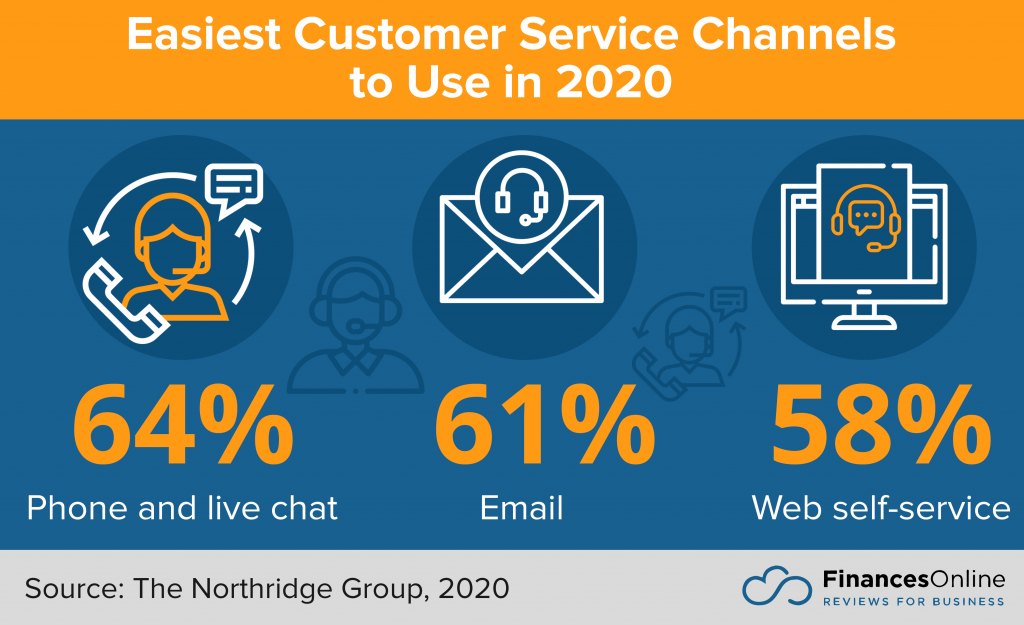
Easiest Channels to Use: Phone and Live Chat Dominate
- Together with online chat, phone has been deemed as the easiest channel to use with 64% of customers agreeing (The Northridge Group, 2020)
- These are followed by email (61%), web self-service (58%), mobile app (57%), and text message at 55% (The Northridge Group, 2020).
- The two channels with the lowest ratings are live video chat and social media at 49% and 47%, respectively (The Northridge Group, 2020).
Live Chat and Messaging Statistics: New Go-To Customer Service Channels
- As messaging support has become the go-to channel for customers, 74% who have messaged companies for the first time in 2020 plan to keep doing so (Zendesk, 2021).
- In fact, 41% of customers prefer live chat. However, 42% of businesses think that customers would rather have phone interactions. (Kayako, 2021)
Top Messaging Channels Used by Companies by Growth (Zendesk, 2021)
- 62% – WhatsApp
- 51% – Facebook Messenger
- 47% – SMS/Texting
- 29% – Web Messaging
- 27% – In-App
How do 18 to 24-year-olds prefer to message a business? (Zendesk, 2021)
- 40% – via their website or mobile app
- 35% – social messaging app
- 21% – SMS/texting
- 3% – none of the above
How do 25 to 39-year-olds prefer to message a business?
- 42% – via their website or mobile app
- 39% – social messaging app
- 17% – SMS/texting
- 3% – none of the above
How do 40 to 54-year-olds prefer to message a business?
- 47% – via their website or mobile app
- 31% – social messaging app
- 20% – SMS/texting
- 3% – none of the above
How do people aged 55 and above prefer to message a business?
- 48% – via their website or mobile app
- 24% – social messaging app
- 22% – SMS/texting
- 5% – none of the above
The Benefits of Having Messaging and Live Chat Channels
- 79% of companies say that live chat has had a positive impact on customer loyalty, sales, and revenue (Kayako, 2021).
- 38% of consumers will more likely buy from a business that offers live chat support (Kayako, 2021).
- 51% of customers are more likely to stick with or purchase again from a business that provides live chat support (Kayako, 2021).
- Indeed, 63% of consumers who spend $250 to $500 per month online are more likely to buy from and remain loyal to a business that offers live chat support (Kayako, 2021).
- Companies that leveraged live channels during the pandemic solved 32% more tickets (Zendesk, 2021).
Live Chat Satisfaction Statistics
- Around the world, the customer satisfaction rate for live chat usage has increased since 2017 by 5 percentage points. This is a large dip from 2015’s 85.4% (Comm100, 2021).
- In 2017, the customer satisfaction rate was 80.6% and went back up to 85.6% in 2021, just 0.2% above of 2015’s figure (Comm100, 2021).
- The statistical trend is also mirrored in the global contact center satisfaction index, especially in the private sector. In 2016 and 2017, the index score was only 68. Then, the next year, it rose to 70. But, in 2019, it went back to 68. In 2020, however, the index score reached 71 (CFI Group, 2020).
- The story is different though when it comes to contact center satisfaction in the government sector. From 2017 to 2018, the sector received a score of 68. This then dropped to 63 the next year. In 2020, it rose slightly to 64 (CFI Group, 2020).
Live Chat Wait Times by Industry Around the World in 2021 in Seconds (Comm100, 2021)
The worst customer service experience, according to 76% of customers is a long wait time in reaching an agent. It seems that the industry with the worst performance when it comes to waiting time is, ironically, tech. It is a good thing that health services have an average live chat wait time of just 6 seconds.
- 88 – Technology
- 70 – Education
- 53 – Transportation
- 50 – Travel
- 44 – Business Service
- 42 – Telecommunications
- 36 – Banking and Finance
- 29 – Entertainment
- 24 – Manufacturing
- 24 – Government and Non-Profit
- 10 – Retail/Ecommerce
- 10 – Consumer Products and Services
- 6 – Healthcare
- 0 – Real Estate
Are AI and chatbots the future?
To help cut the wait time, many companies have opted to use AI software to help with their live chat support. Even Facebook provides companies registered with the ability to create their own automatic reply templates. Of course, top live chat software platforms also provide AI and automation features.
- A more recent report found that 41% of consumers believe chatbots and artificial intelligence software can potentially enhance their customer experience. 59% think otherwise (Conversocial, 2020).
- Retail companies that use chatbots are seen by customers as efficient (47%), innovative (40%), and helpful (36%) (Peart, 2020).
- Despite the rise of chatbots, 70% of consumers still prefer human agents to AI technologies (99Firms, 2020).
Businesses Scrambling to Meet Customer Service Needs
Even before the pandemic, businesses have been scrambling to meet customer service demands. This is reflected by the increase in contact center opening and expansions from 2016 to 2020. The boom was not just in the United States but also worldwide.
Number of Call Centers Opened or Expanded from 2016 to 2020 in the US (Site Selection Group, 2021)
- 2016 – 223
- 2017 – 215
- 2018 – 153
- 2019 – 164
- 2020 – 138
- This is a total of 893 in just five years.
- Also, this is 154 more than those that opened or expanded in Latin America, Western Europe, the Philippines, Asia-Pacific, Canada, India, Eastern Europe, Middle East, and Africa combined at 739.
Number of Call Centers Opened or Expanded from 2016 to 2020 in Other Countries/Regions
- Latin America – 171
- Western Europe – 165
- Philippines – 146
- Asia-Pacific – 59
- Canada – 59
- India – 59
- Eastern Europe – 42
- Middle East – 17
- Africa – 21
Contact Center Jobs in the United States (Bureau of Labor Statistics, 2021)
This has also led to an increase in contact center jobs in the country.
- 2.51M – 2014
- 2.6M – 2015
- 2.71M – 2016
- 2.77M – 2017
- 2.87M – 2018
- 2.92M – 2019
- 2.83M – 2020
Also, to higher customer experience capability evaluation by customers.
CX Capability Evaluation by Customers Worldwide by Region in 2021 (NTT, 2021)
- The Americas had the highest share of customers ranking CX capability as excellent at 17.1%. The majority, at 62.2%, rank the general CX capability of firms as seven, eight, or nine out of ten.
- This is followed by the Asia Pacific region with 8.3% of consumers stating the CX capability is excellent in the region. The majority, at 63.4%, rank CX capability in a region to be either seven, eight, or nine on a scale of one to ten.
- Only 8% of consumers in Europe rank the region’s CX capability as excellent. A good 18.3% ranked it as a seven out of ten, 27.2% ranked it as an eight out of ten, and 17.9% scored it a nine out of ten.
- The Middle East and Africa region has the second-highest share of consumers, ranking its CX capability as excellent at 15.5%. Another 15.5% rank its CX capability as a nine; 23.2% rank it as an eight, and 22.7% rank it as a seven.
Source: Site Selection Group, 2021
Omnichannel Customer Service Demand Statistics
Businesses should not only try to be competitive in just a few channels. They should also strive to build an omnichannel presence, especially in the on-demand era exacerbated by the pandemic. If you still do not know which aspects you should improve your customer service efforts on, then you might as well start on the top-rated negative customer experiences that contribute to bad customer service statistics and ratings.
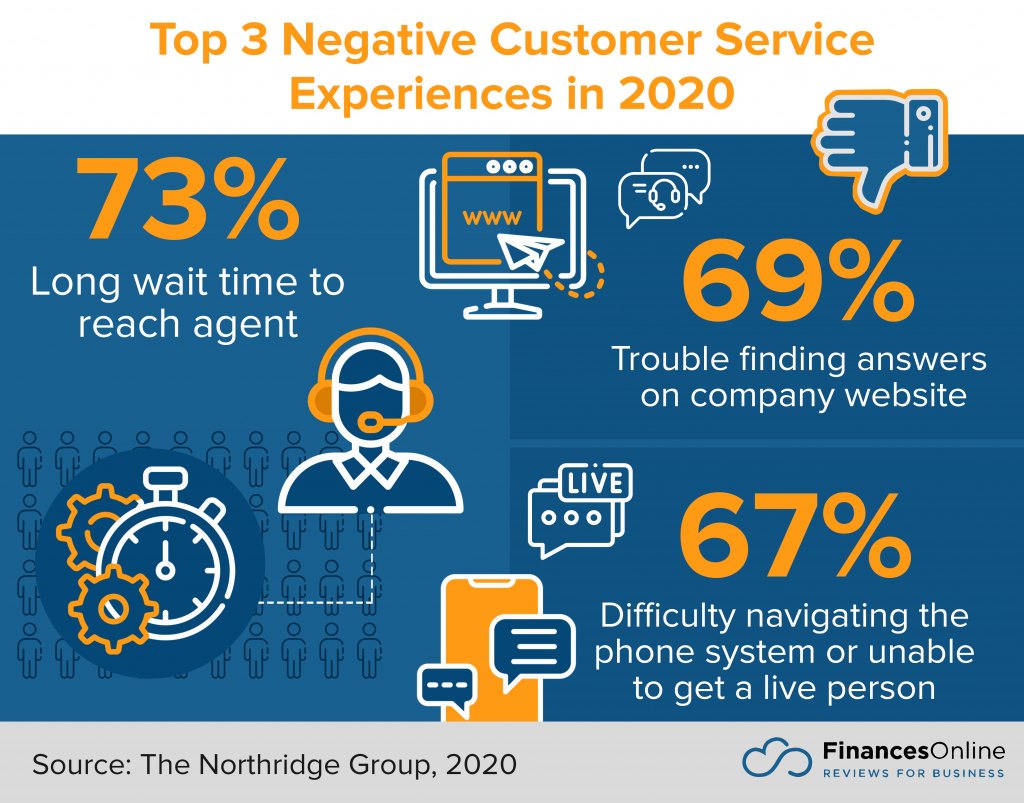
Top Negative Customer Service Experiences (The Northridge Group, 2020)
- 73% – long wait time to reach an agent
- 69% – trouble finding answers on the company website
- 67% – difficulty navigating the phone system or unable to get a live person
- 66% – difficulty accessing live/human customer support
- 60% – asked to repeat information over and over again
Digital Orders: A Growing Part of Customer Journeys
And, as digital orders are a growing part of the customer journey, they too can be a source of many of these pain points. This is especially so as customer service statistics COVID survey pointed out, online shopping has increased and will likely stay on that level or grow further.
- During the pandemic, 68% of customers have increased their online shopping (The Northridge Group, 2020).
- Also, 68% plan to shop at the same rate or even more after the pandemic (The Northbridge Group, 2020).
- First contact resolution declined from 53% to 42%. This has increased customer effort and the costs for businesses (The Northridge Group, 2020).
As digital orders have a large share of the overall revenue, companies should really mind how the omnichannel customer journey should be curated. Here are relevant retail customer service statistics to give you an idea:
- A good 26.6% of revenue in retail comes from digital orders. The breakdown is as follows (IHL Group, 2021).
- 10.2% – Ecommerce with Delivery Form Warehouse
- 5.5% – BOPIS (Buy Online Pickup in Store, Shipped to Store for Pickup)
- 4.5% – Local Delivery from Store or Other Methods
- 6.4% – Ship From Store
This also involves brick-and-mortar operations. Thus, organizations should make it a point to create a seamless customer experience between online and physical presence.
- In 2020, 89.8% of orders are fulfilled with the involvement of stores (IHL Group, 2021).
Unfortunately, many businesses have not optimized their customer journey road maps. Thus, they incur avoidable losses.
Average Margin Point Loss from Traditional Store Visit When Not Optimized (IHL Group, 2020)
- 8.1 – BORIS (Buy Online Return in Store)
- 4.4 – Click and Collect (Same Day Pickup at Store)
- 3.6 – Curbside Pickup
- 6.8 – BOPIS (Buy Online Pickup in Store, Shipped to Store for Pickup)
- 6.3 – Buy in Store from Warehouse
- 3.3 – Buy in Store, Pickup in Another Store
Optimized Stores for Customer Journeys Get Higher Margins
- 17.1x – BORIS (Buy Online Return in Store)
- 13.5x – Click and Collect (Same Day Pickup at Store)
- 6.7x – Curbside Pickup
- 6.1x – BOPIS (Buy Online Pickup in Store, Shipped to Store for Pickup)
- 2.3x – Buy in Store from Warehouse
- 1.6x – Buy in Store, Pickup in Another Store
Share of Retailers Who Have Optimized Customer Journeys
- 30% – BORIS (Buy Online Return in Store)
- 22% – Click and Collect (Same Day Pickup at Store)
- 24% – Curbside Pickup
- 27% – BOPIS (Buy Online Pickup in Store, Shipped to Store for Pickup)
- 28% – Buy in Store from Warehouse
- 16% – Buy in Store, Pickup in Another Store
Key Customer Service Success Factors Statistics
In order to have a strong omnichannel presence, one must understand customer psychology. This is especially on the key factors that affect customer satisfaction. When successfully addressed, a business can reap hard-earned benefits.
The Top Factors that Impact Customer Satisfaction (NTT)
- 70.7% – Ease of Resolution (Customer Effort)
- 52.5% – Agent Knowledge
- 42.8% – Ease of Contact (Choice/Accessibility)
- 40.5% – Time Taken to Resolve Queries
- 23.9% – Organizational Policies
- 22% – Same Issues Occur Repeatedly, feedback goes unanswered
- 16.2% – Digital Channel / function doesn’t work
- 10.8% – Preferred Channel Not Available
- 9.2% – Can’t trust services will be delivered
- 5.9% – Other
- 3.6% – Difficult to speak with a human
Benefits of Good Customer Service Statistics (HubSpot, 2021)
- The majority of customers, at 73%, say that they stay loyal to brands because of friendly customer service agents. (HubSpot, 2021)
- Also, a good number of repeat customers, at 67%, are more likely to spend more because of excellent customer service. (HubSpot, 2021)
- A 5% rise in customer retention of merely 5% can result in a 25% increase in profit. (HubSpot, 2021)
CX Performance by Industry
Contrary to what many people feel and the inefficiency of the local DMV jokes, the public sector, in a study, had the biggest share of customers that feel that organizations within the sector provide excellent service. This is followed by banking and investment. The one with the lowest share of customers that rank services to be excellent is the energy and utilities industry.
- When it comes to the capability of organizations to deliver excellent customer experiences, the public sector has the most number of consumers that feel that they provide an excellent (10/10) customer experience at 15.6%. The majority, however, at 21.9% only rank the public sector’s CX capability as a seven out of ten (NTT, 2021).
- The industry with the second-highest share of excellent customer experience rating is the financial services – banking and investment – industry with 14%. The majority of consumers, at 63%, rank CX capability with a score of either seven, eight, or nine (NTT, 2021).
- This is followed by retail and wholesale with 13.8%, ranking the industry’s CX as excellent. The majority of customers, at 50.7%, rank CX capability as an eight or a nine (NTT, 2021).
- Other industries with more than 10% of customers ranking their CX as excellent include the automotive industry (12.9%), education (11.1%), and healthcare and pharmaceuticals (10%) (NTT, 2021).
- The three industries that received the lowest shares of excellent ranking are manufacturing (7.9%), insurance (6.8%), and energy and utilities (5.2%) (NTT, 2021).
Top 3 Factors That Impact Customer Satisfaction
Source: NTT
Designed byCustomer Service Software Industry Statistics: Is AI on the Horizon?
There are many types of digital tools that can aid businesses in improving their customer service operations. The best tools, in fact, are those with omnichannel capabilities. Also, they may have features and modules that intersect with other business operations like marketing and sales. One of the most popular types of software used for customer service is a CRM solution.
- In 2015, CRM software market revenue only reached a little north of $24 million. In 2019, it reached $42.7 million. That is a 77.9% growth. (Apps Run The World, 2021)
- In 2021, it was estimated to have reached $43 million. (Apps Run the World, 2021)
- By 2024, it is expected to reach a figure north of $43.5 million. (Apps Run the World, 2021)
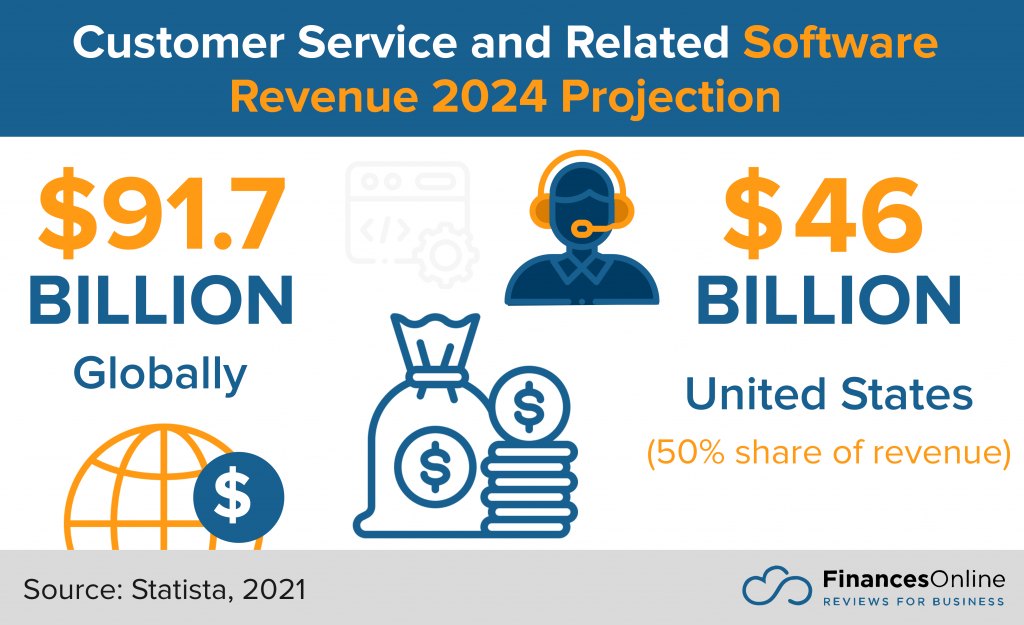
- Together with other adjunct software, including marketing and sales applications, CRM and customer service software revenue is likely to reach $91.7 billion by 2024. (Statista, 2021)
- The United States is likely to account for a little more than 50% of the revenue with a projected figure north of $46 million. (Statista, 2021)
Financial Services and AI: Enhancing Personalized Service and Customer Satisfaction
- Globally, 32% of financial services firms believe that AI can enhance customer personalized service and customer satisfaction. The share of financial services firms that believe this per region are the following. (Forbes, 2020)
- 36% – North America
- 35% – Europe
- 26% – Asia-Pacific
And, one of the most popular AI tools in customer service is chatbots. But, like all digital tools, they have their advantages and disadvantages, especially from the customer’s point of view.
Most Helpful Things About Chatbots (Zendesk, 2021)
- 29% – get answers outside business hours
- 27% – get faster replies
- 19% – get an accurate answer
- 18% – none of the above
- 7% – don’t need to talk to a human
Most Frustrating Things About Chatbots (Zendesk, 2021)
- 43% – can’t get an accurate answer
- 31% – start over when getting a human agent
- 23% – can’t get through a human
- 3% – none of the above
There are growing concerns that they will take jobs from humans. However, using AI in customer service and CRM has produced plenty of jobs.
Estimated Jobs Indirectly and/or Induced by AI, 2017 to 2021 (IDC, 2020)
- From 2017 to 2021, the estimated net increase in indirect and/or induced jobs in CRM because of AI around the world is estimated to have reached 1,250,247 (IDC, 2020). Here they are by year:
- 75,203 – 2017
- 471,819 – 2018
- 254,784 – 2019
- 228,582 – 2020
- 219,853 – 2021
This is because AI will not be absolutely replacing humans in customer service. They are there to help resolve easier types of inquiries and concerns. This is why many successful companies have a hybrid human-AI setup. AI can be used for routing and other menial service tasks while humans are there to handle more complex issues. And, of course, provide that human touch.
Having a good balance, however, can be hard. So, you can use these customer service statistics 2021 edition about the human and AI interaction preferences of customers.
Preferences for Automated Interactions (Zendesk, 2021)
- 41% – tracking an order
- 32% – checking status or balance
- 22% – changing an order
- 22% – none; I don’t want an automated transaction
- 21% – return or exchange
- 19% – requesting a quote
- 19% – asking for technical support
- 18% – billing or payment question
- 17% – filing a complaint
- 6% – none of the above
Preferences for Human Interactions
- 40% – filing a complaint
- 40% – asking for technical support
- 32% – return or exchange
- 31% – billing or payment question
- 27% – changing an order
- 23% – requesting a quote
- 20% – all of the above
- 13% – tracking an order
- 13% – checking status or balance
- 6% – none; I don’t want a human interaction
Most Popular Customer Service Software
- Zendesk. This is a suite of support apps for proper omnichannel customer support, including superb modules for CRM and lead generation. You can read our review to find out more about the product and the various Zendesk pricing and features.
- Freshdesk. Another customer service platform with great multi-channel support, Freshdesk is known for its easy-to-use and customizable intelligent ticketing management module. Read our review to find out more about its features and available Freshdesk pricing plans.
- Salesforce Service Cloud. Salesforce is the most recognizable CRM and total customer service platform. It has a whole array of software tools in its arsenal, including artificial intelligence software. You can check out Salesforce pricing and features in our in-depth review.
- Freshservice. Freshservice focuses on IT service management. It is perfect for organizations and tech, thanks to its industry-specific features. Read all about Freshservice pricing and features in our detailed review.
- HubSpot Service Hub. Hubspot Service Hub is fitted with omnichannel support features, ranging from calls and live chat to email. This works best with other HubSpot products but it is also a great standalone tool. Read more about its features and the available HubSpot pricing plans.
Bullish: The Future of Customer Service Statistics
Given the COVID-19 experience and the shift to or the heavy incorporation of digital tools, many businesses and professionals are bullish on improving customer experience (CX) through better customer service. And, one of the latest customer service trends in 2021 is personalization. The focus on CX in customer service seems to be just warming up.
- In fact, 45.9% of businesses say that customer experience is their top priority for the next five years (SuperOffice, 2021).
Professionals Viewing Customer Experience as a Competitive Differentiator for Their Organization by Role in 2021
- Among CEOs, 53.8% view CX as a primary differentiator; 40.3% view it as partially a differentiator, and only 5.9% do not consider it as a differentiator at all. (NTT, 2021)
- A good 52.4% of IT professionals see CX as a primary differentiator; 42.3% see it as a partial differentiator; and only 5.4% don’t think that it is a differentiator at all. (NTT, 2021)
- Moreover, only 50.5% of CX professionals view customer experience as a primary differentiator while 46% see it as a partial differentiator. Only 3.5% believe that it is not a differentiator at all. (NTT, 2021)
- Also, a good 39.7% of digital professionals see CX as a primary differentiator. The majority, at 50%, view it as a partial differentiator while 10.3% do not think that it is a differentiator at all. (NTT, 2021)
- Furthermore, the majority of professionals working in customer service and operations, at 53.9%, view CX as a partial differentiator. A considerable 36.7% believe that it is a primary differentiator. The other 9.4% do not believe that it is a differentiator. (NTT, 2021)
- Also, the majority of marketing professionals, at 53.6%, only view CX as a partial differentiator. A good amount of them, at 35.2%, see it as a primary differentiator. Only 11.2% do not believe that it is a differentiator. (NTT, 2021)
Percentage of Professionals That View CX as a Primary Competitive Differentiator for their Organization by Sector in 2021
- 62% – Financial Services – Insurance
- 53.9% – Media, Communications, Telecoms
- 53.4% – Technology
- 48.1% – Financial Services – Banking/Investment
- 47.4% – Manufacturing
- 46.4% – Professional Services
- 43.4% – Automotive
- 41.1% – Energy and Utilities
- 39.9% – Retail and Wholesale
- 39.8% – Public Sector
- 38.5% – Healthcare and Pharmaceuticals
- 33.3% – Sports, Entertainment, and Hospitality
- 32.7% – Travel and Transportation
- 29.2% – Education
- 20% – Other
Source: NTT, 2021
A New Era for Customer Service?
From our customer service statistics for 2022 compilation, we can see a clear trajectory. This can be encapsulated using two buzzwords: omnichannel and hybridization. Customer service of the near future will move towards a direction where humans and computers work together to find solutions to customer issues. This will not only be in phone and chat support but also in other areas like content creation and curation in self-service channels.
This would also involve the heavier use of analytics and machine learning, especially with customer service diagnostics and optimization. Computers, as they already do today, will provide a firm data-driven basis for human social intuitions within the context of customer service. In fact, digital customer service and sales-related solutions include artificial intelligence software packages or modules.
However, as we embrace a more digitally immersive world, we may forget what really matters. That is the human experience that matters to make a customer out of a person and maintain that great relationship. So, as you optimize your digital customer service touchpoints, remember to keep an eye on and improve on your physical touchpoints. A warm welcome and a smile will always go a long way. No matter the numbers presented in this customer service software statistics, these are the things that really matter.
References:
- 99Firms. (2021, August 20). Live chat statistics. 99firms.
- Amaresan, S. (2021, January 5). 12 data-backed reasons customer service is key to business growth. HubSpot.
- Aspect, & Conversion Research. (2019). Aspect consumer index report 2020. Avaria.
- CFI Group. (2020, June 2). Contact center satisfaction index (CCSI) 2020. CFI Group.
- Columbus, L. (2020, October 31). The state of AI adoption in financial services. Forbes.
- Comm100. (2021). Live chat benchmark report 2021. Comm100.
- Conversocial. (2020). The state of customer experience trends report 2020. Conversocial.
- EY. (2020, October 22). Global: Share of shoppers that valued customer service 2020. Statista.
- IDC. (2020). The economic impact of AI. Salesforce.
- IHL Group. (2020, April 17). Average margin point loss of retailer’s when an omnichannel service customer journey is not optimized worldwide in 2020. Statista.
- Kayako. (2021, March 12). Live chat statistics. Kayako.
- The Northridge Group. (2019). State of customer service experience 2020. The Northridge Group.
- NTT. (2019). Global customer experience benchmarking 2019. NTT.
- NTT. (2021). Global customer experience benchmarking 2021. NTT.
- Pang, A. (2021, December 24). Top 10 CRM software vendors, market size and market forecast 2020-2025. Apps Run The World.
- Peart, A. (2020, May 19). Chatbot statistics: 2020 & beyond. LinkedIn.
- Satista. (2021). Customer relationship management software – Worldwide. Statista.
- Satmetrix. (2021, August 31). 2021 B2C NPS benchmarks at a glance. Satmetrix.
- Site Selection Group. (2021). Whitepaper: 2021 call center location trends report. Site Selection Group.
- Smith, T. (2021, May 27). The impact of COVID-19 on customer experience. Zendesk.
- Statista. (2020). Customer satisfaction: Retention rates by industry worldwide 2018. Statista.
- Statista. (2021, March 19). Bank satisfaction with customer services worldwide 2021. Statista.
- Statista. (2021). Top 25 companies: Customer experience. Statista.
- SuperOffice. (2021, June 24). 37 powerful customer experience statistics to know in 2021. SuperOffice.
- Zendesk. (2021). Customer service gets conversational. Zendesk.


I agree with the appliance and technology product are areas that I expect more from the experience; price point may have something to do with the high expectations..
I am very familiar with the Contact Center culture, and the percentages seems correct. We strongly drive our reps to ensure that we give the customer an excellent experience, even when we have to deliver bad news.
Leave a comment!