
In the age of widespread Internet and Internet-of-Things technology, many companies now realize the importance of properly leveraging the data they collect from consumers. This is why business intelligence software serves as an important addition to any modern business’ tech stack. Through business intelligence (BI) apps, organizations can easily analyze data, make data-driven decisions, and drive improved business performance.
This article compares two of the most popular BI solutions today: Sisense and Tableau. In comparing these two industry-leading programs, we’ll explore each program’s unique strengths, along with features such as data visualization, data integration, and adaptive data analytics.

Sisense vs Tableau Comparison Table of Contents
With market competition growing tougher each day, businesses need all the help they can to stand out and get ahead. Big data, and, more importantly, business intelligence, help companies gain the competitive advantage they need. Big data provides businesses with valuable insights into customer behavior. More importantly, the use of business intelligence systems has also been found to improve profitability and minimize profit risks.
Various studies also show how, in the past years, businesses have grown in their capabilities to efficiently use data to meet key metrics. One study, for instance, revealed that nearly 50% of companies have driven innovation using big data.
Source: NewVantage Partners
Business intelligence tools have proved to be crucial to helping organizations find the exact datasets they need for analyzing business performance. This article aims to compare Sisense and Tableau, two of the best-known business intelligence platforms today. Each app has its own strengths and weaknesses, and, hopefully, by the end of this article, you’ll figure out which software best meets your needs.
Overview of Sisense and Tableau
Sisense

Sisense is a business intelligence software that makes it easier for businesses to collect, analyze, and present data. Through the platform, users can explore and connect various data points even without coding knowledge. Sisense also allows organizations to effortlessly embed analytics into products and applications for easier collaboration.
One of the core features of Sisense is that it supports efficient data visualization. The platform’s interface comes with drag-and-drop functions so users can easily build customized dashboards in minutes. The platform’s smart calculation and charting options also take the guesswork out of data visualization, so users can focus on data analysis. These visualizations are interactive as well, so you can drill down into insights if needed.
Detailed Sisense Review
In addition to easy data visualization, Sisense also offers AI-enhanced analytics. Through Sisense, users can easily create forecasts with flexible settings and based on historical data. Machine learning technology also continuously checks data for anomalies, sending pulse alerts in case it detects irregularities or variations in business data.
Moreover, Sisense makes it easy for organizations to embed analytics within applications. Users have the option to embed widgets and dashboards using iFrame HTML tags, embedded SDK, or full Javascript libraries. These flexible options ensure that users can completely customize the appearance of analytics elements.
Tableau

Tableau is a business intelligence system that supports visual analytics, making it easier for users to manage data and discover insights. The platform offers different solutions, including Tableau Desktop, Tableau Server, and Tableau Online, to meet organizations’ different needs. Users also don’t need programming skills to use Tableau products for creating and sharing analytics dashboards.
Tableau Desktop is a self-service analytics platform that helps users build interactive dashboards with live visual analytics. These live analytics support more efficient data exploration. Tableau Desktop also allows users to connect different data sources without the need to write code.
Detailed Tableau Review
Meanwhile, Tableau Server allows entire organizations to benefit from business analytics without compromising security. Users can also make queries with natural language through the product’s Ask Data feature. This feature uses advanced algorithms to profile and index data sources and provide data visualizations in response to queries.
Tableau Online is also another product that allows users to create and publish their own dashboards, only the data is fully hosted in the cloud. And since Tableau Online is a fully hosted solution, there’s no need for IT teams to configure servers or upgrade software.
Comparison of Sisense vs. Tableau
Core Features
Customizable/Smart Data Visualization
The most significant benefits of using business intelligence include the ability to produce smart, customizable visualizations of data. Such visualizations make data more engaging and easier to digest, helping users identify insights. According to our comparison of Sisense vs Tableau, these two BI solutions are no exceptions in this aspect.
For instance, Sisense is packed with features that support users in turning numbers into customized visualizations. The platform provides smart calculations and chart options based on your data and analysis. Through Sisense, users can create interactive visualizations, as well. These analytics elements allow users to filter or drill down into specific insights and make decisions based on real-time data.
Moreover, Sisense comes with a drag-and-drop user interface that teams can use to build customized dashboards. These dashboards offer a high level of customization, too, as users can add images, text, links, and videos.
Meanwhile, Tableau offers data visualization capabilities that are just as versatile. Users have the option to build visualizations from scratch and create data hierarchies to drill into. Tableau also helps users focus their data exploration through filters. Of course, teams can also use a wide variety of charts, graphs, and maps to make data easier to understand.
Similar to Sisense, Tableau also allows users to combine different visualizations. For instance, Tableau users can build stories, which are sequences of visualizations that can be used to provide context or tell a narrative. Users can also put together dashboards, which simultaneously display different data views.

Sisense’s user interface supports drag-and-drop functions for easier creation of visualizations.
Data Integration
Big data is a valuable asset to businesses, but only if it’s properly visualized and analyzed through software like BI tools. This is why both Sisense and Tableau allow users to integrate data into their chosen platform. Our Sisense vs Tableau comparison also indicates that both platforms provide plenty of connectors that support easy data access.
For example, Sisense offers over 100 data connectors so users can fully benefit from the platform’s features no matter where their data is connected. These connectors allow users to access data from business applications, cloud data warehouses, or databases. Such data connectors include:
- Airtable
- Apache Cassandra
- Azure Data Explorer
- Bing Ads
- Clickhouse
Sisense also allows users to create live data connections where queries are run directly against the data source. In this way, users can take advantage of the power of data warehouses like Google BigQuery and Amazon Redshift. Users also have the option to use Elasticube, Sisense’s proprietary analytics cache, to merge data from multiple sources into one data set.
Likewise, Tableau provides teams with a wide variety of data sources to ensure hassle-free data access. With these data connections, Tableau users can easily access data on-premise or on the cloud. Users can also manage or split metadata for further optimization. Below are some of the data sources compatible with Tableau:
- Alibaba Data Lake Analytics
- Box
- IBM BigInsights
- Marketo
- Oracle
Tableau also supports a variety of file formats, including JSON, KML, PDF, R, SPSS, SAS, and CSV. You can also use web data connectors to integrate web-based data into the platform.
Mobile Experience
In an age where hybrid work is becoming popular and more people work outside the office, a platform’s mobile experience determines its usefulness. The same can be said for BI tools, and this comparison of Sisense vs Tableau shows that both platforms offer a seamless mobile experience.
On the one hand, Sisense Mobile provides plenty of features so users can remain productive even on Android or iOS devices. These apps come with a user-friendly UI that connects users to their dashboards and displays mobile-ready visualizations on demand. You can also drill down into the data in most widgets. For easier collaboration, you can share data widgets as PNG images as well.
Sisense Mobile also supports various gestures to allow users to explore data on their dashboards. Users can swipe across visualizations, pinch in to zoom into visualizations, or pinch out to expand. Moreover, through Sisense Pulse, you can set push notifications by setting up data alerts for your widgets.
On the other hand, Tableau offers an equally hassle-free mobile experience through Tableau Mobile. Tableau Mobile is an enterprise-ready app available to iOS and Android. The app allows users to get personalized data headlines of their most important KPIs. It also comes with powerful search technology to help users quickly find the visualizations they need. For added convenience, these visualizations are optimized for viewing on mobile devices.
Tableau Mobile also comes with various security features to ensure protection for data and devices. It supports authentication methods such as OpenID Connect and Mutual SSL. You can also use a VPN or reverse proxy when connecting to Tableau Mobile.

Tableau’s mobile apps provide easy access to dashboards.
Tailored/Adaptive Analytics
Sisense and Tableau wouldn’t be considered two of the best business intelligence systems today if they didn’t offer utmost versatility. Both platforms are flexible enough to provide users with the ability to put together any number of dashboards with the specific visualizations they want. By providing adaptive analytics, these systems can be used to the benefit of the entire organization.
As we’ve previously discussed, Sisense provides users with drag-and-drop functions for building dashboards that are tailored to the teams that will use them. For instance, Sisense can be used to create a dashboard that indicates how IT teams stack up against department KPIs. Through connectors to data sources, business analysts can gather and collate data on metrics such as Average Time to Resolution, Number of Tickets, and Resolved Tickets.
In turn, CIOs and other IT executives can view this custom dashboard and quickly identify areas for improvement and potential weak spots. Visualizations and elements such as images can make the data easier to understand so insights can be discovered readily.
Likewise, Tableau can be used to accurately track the performance of IT teams. Tableau also provides a wide variety of data connectors to integrate multiple sources of data. This makes it easier for managers and C-suite executives to analyze data and manage IT analytics, even if data is spread across different sources.
For instance, using Tableau, you can build an executive IT dashboard to view active incidents and problems as well as monitor network utilization. Such insights can help users get ahead of problems and minimize downtime.
Lends to Governed Deployment
A sound data governance strategy ensures that the availability and security of data are properly managed across all users in the enterprise environment. Such strategies also provide transparency of data ownership and encourage collaboration while preventing data silos.
When you compare Sisense and Tableau, you’ll see that the two platforms offer different models when it comes to the deployment of data. For instance, Sisense tackles governed deployment through the monitoring of five user roles: Viewer, Data Designer, Designer, Data Administrator, and Administrator. Each role comes with its access and security settings, which administrators can control and configure.
Meanwhile, Tableau offers different data governance models that organizations can use. The platform offers three main governance models: centralized, delegated, and self-governing. Organizations can switch between these models as their needs change over time. Below is a brief description of each governance model.
Centralized Governance Model
In the centralized model, an authority takes complete ownership of data access. A small number of creators also produce all visualizations and dashboards for business use. This setup is typically ideal for protecting highly sensitive or confidential data.
Delegated Governance Model
Tableau’s delegated governance model provides new roles aside from the central authority. For instance, organizations can set up Site Administrator roles that can access data sources. Some data consumers also have access to data sources so they can find the data they want.
Self-Governing Model
In this governance model, data management has moved beyond the IT department’s responsibility. IT and business users also collaborate to produce visualizations as needed. Moreover, users can also seamlessly switch between consuming and creating content.
Historical Data Trends Analysis
Both Sisense and Tableau also offer powerful features that support users in analyzing historical data and identifying trends. These systems come with connectors for data sources like Excel, MySQL, and PDF. Once data is integrated into the Sisense or Tableau platform, users can start analyzing trends.
Through Sisense, users can add trend lines to column, area, line, and bar charts to highlight patterns in the data and identify trends. This BI tool also supports four different trend types: linear, logarithmic, exponential smoothing, and local estimates. Moreover, users can add more than one trend line to charts and configure the system to ignore anomalies. Such features empower users in efficiently analyzing data.
Like in Sisense, Tableau also lets users add trend lines to their visualizations. Users can choose from five types of trend lines: linear, logarithmic, exponential, power, and polynomial. The platform also comes with features to help users determine how well the trend type fits the model.
Through Tableau, users can quickly identify and analyze trends and create forecasts.
Pre-built Analytics Templates with Customization Features
For faster adoption among organizations, both Sisense and Tableau come with pre-built analytics templates. These templates can be easily customized according to users’ needs. Our Sisense vs Tableau comparison indicates that there are some differences between the platforms’ pre-built analytics features.
Sisense offers pre-built analytics templates through the BloX dashboard. This dashboard features various templates for creating customized widgets for your organization’s data. You can also configure the look and feel of each BloX widget for further customization. You have the option to add images, embed iFrames, and add multiple actions to widgets as well.
In addition to BloX, Sisense comes with ready-to-use business intelligence dashboard reports for specific industries. These reports come with sample KPIs and visualizations that users can modify for their organization.
Meanwhile, Tableau also offers pre-built analytics through Accelerators. Accelerators allow users to quickly connect to commonly used enterprise applications and create visualizations and dashboards from your organization’s data. Tableau comes with built-in Accelerators for Salesforce, Oracle Eloqua, and ServiceNow, supporting users in visualizing their sales, email marketing, and IT management data, respectively.
Aside from using Accelerators, Tableau also allows teams to save dashboard layouts as a style template. In this way, users can just swap out data sources and keep style elements of commonly used dashboards.
Security
Due to the functions of business intelligence tools, both Sisense and Tableau are built on robust, comprehensive security features. Sisense, for instance, comes with a flexible security architecture that supports scalability without compromising data integrity. The platform also currently offers three levels of security features that keep dashboard data safe: system-level, object-level, and data-level.
Sisense’s system-level security features include user and server management, the use of security REST API, and SSO implementation. These features are mostly focused on managing which users and integrations have access to the Sisense platform. Meanwhile, with Sisense’s object-level security features, you can define who can access dashboards and data models within the platform. These objects can be shared on a user or group level to improve security.
Meanwhile, Sisense’s data-level security features can be applied to specific rows in data. In this way, you can configure dashboards so viewers can see only the data that they need.
On the other hand, Tableau offers state-of-the-art authentication features. Tableau Server, for instance, supports authentication via Kerberos, OpenID Connect, SAML, and Active Directory. The platform also offers built-in local authentication. Like Sisense, Tableau also provides authorization capabilities in the form of roles and permissions on user and group levels.
Moreover, Tableau users have the option to enforce security rules using only database authentication or implement these standards only in the Tableau platform.
Sisense vs. Tableau Core Features Takeaways:
- Sisense and Tableau are both packed with features that can help organizations take advantage of data analytics to improve business performance.
- The platforms offer highly similar, versatile capabilities in data visualization, dashboard creation, and data sourcing.
- Both platforms also offer a seamless mobile experience through the Sisense and Tableau mobile apps for Android and iOS.
- However, Tableau provides more flexibility in terms of data governance, with centralized, delegated, and self-governed models.
- Meanwhile, Sisense allows users to custom-build not only visualizations and dashboards but also analytics apps, even with minimum coding knowledge.
Integrations
As we’ve previously discussed, Sisense and Tableau are evenly matched when it comes to integrations and connectivity. Both platforms offer a wide variety of connectors so users can access their data no matter where it’s stored. Some common data connectors offered by both platforms are Microsoft SQL Server, Amazon Redshift, Box, Denodo, Google BigQuery, and Snowflake.
Sisense also has a marketplace where users can choose from a wide variety of add-ons and integrations. Add-ons extend the features of the platform and include plugins that improve the accessibility and functionality of widgets and dashboards. Moreover, Sisense integrates with platforms like Adobe XD and OvalEdge, which ease the creation of visualizations and widgets and improve data governance.
Sisense vs. Tableau Integrations Takeaways:
- Both platforms offer a wide variety of data connectors for commonly used databases and data warehouses, like Microsoft SQL Server and Snowflake.
- There’s limited information on Tableau’s other integrations. Sisense, on the other hand, has a marketplace packed with add-ons and integrations that extend the software’s functionality.
Pricing
If you’re wondering how much BI software costs, you’ll find that Sisense and Tableau take significantly different approaches to pricing. On one hand, Sisense goes by custom pricing. This means interested users must contact the vendor to have a customized plan and a quote created for their organization. Some details you’ll be asked to provide to get a quote include your project timeline, project type, data volume, and the expected number of users.
On the other hand, Tableau is more forthcoming with its pricing scheme. Factors such as deployment and user roles affect Tableau pricing. For instance, for deployment fully hosted by Tableau, Tableau Creator costs $70 per user, Tableau Explorer costs $42 per user, and Tableau Viewer costs $15 per user. All these plans are on a monthly basis and billed annually.
Meanwhile, Tableau pricing for on-premises or public cloud deployment is slightly more affordable at $35 per user for Tableau Explorer and $12 per user for Tableau Viewer. Tableau also offers customized pricing for embedded analytics.

Tableau offers various pricing models for teams and individuals, with prices depending on the user roles preferred.
Sisense vs. Tableau Pricing Takeaways:
- Both platforms offer a free trial so interested users can try out their features without a financial investment.
- While Sisense offers only by-quote pricing, Tableau offers various paid plans, with pricing depending on deployment and chosen user roles.
Ease of Use
Both Sisense and Tableau were designed with ease of use in mind. Despite their seemingly complex functions, these platforms have clean, modern interfaces that most users shouldn’t have trouble navigating. Both platforms also provide a low- to no-code environment for users who want to build or customize their own widgets, visualizations, and apps.
Sisense and Tableau also guarantee ease of use through drag-and-drop functions for creating visualizations and putting together dashboards. The platforms’ user-friendly interfaces also make it easier for users to modify the appearance and functions of visualizations.
These platforms also offer advanced technology that ensures the system doesn’t slow down even when users are analyzing large or complex data sets. For instance, Sisense uses proprietary in-chip technology to quickly process large amounts of data and handle simultaneous queries from users. Meanwhile, Tableau users Hy.per, a data engine technology that speeds up the analysis of complex data sets.
Sisense vs. Tableau Ease of Use Takeaways:
- Both platforms offer clean, intuitive interfaces that are easy to navigate, along with low-code environments.
- Sisense and Tableau also come with advanced technology that prevents lags even when processing large and complex data sets.
Getting Started
To get started on Sisense, users must first contact a representative so they can customize the platform according to their organizations’ needs. At this point, users also indicate their deployment of choice: Sisense Managed Cloud Service, your preferred cloud environment, or on-premise.
Of these three options, Sisense Managed Cloud Service is the easiest to adopt. With this deployment, Sisense does most of the heavy lifting, connecting your data sources and taking care of upgrades and maintenance. If you opt for on-premise deployment, you must also make sure that your system meets the platform’s hardware requirements.
Similar to Sisense, Tableau also lets users choose from public cloud or on-premise deployment for Tableau Server. Users can also opt for Tableau Online, which is fully hosted by Tableau. Keep in mind that, although Tableau Server provides more control over hardware and software, the system also requires dedicated administrators.
No matter what deployment you choose, though, Sisense and Tableau offer plenty of support so you can hit the ground running. Both platforms offer comprehensive knowledge bases and documentation, along with active user communities.
Sisense vs. Tableau Getting Started Takeaways:
- These platforms offer different types of deployment: on-premise, your preferred cloud environment, public cloud, and managed cloud.
- The flexibility allows users to choose the best deployment for their organization’s needs.
- Both platforms also offer plenty of resources, including knowledge bases and user communities, for companies who are new to using the systems.
Use Cases
Use cases for Sisense and Tableau tend to be similar since both platforms are flexible enough to adjust to a wide variety of workflows. For instance, within the organization, Sisense and Tableau can be used to analyze data relevant to different departments, including human resources, customer service, marketing, and sales.
From a broader perspective, Sisense and Tableau also offer enough versatility to meet the needs of various industries. For instance, these platforms’ features support more efficient data analytics for organizations in the manufacturing industry. Sisense comes with various sample dashboards that display relevant data and KPI like IoT data streams, cost of goods by region, date, and product area, and warehouse operations.
Tableau also helps manufacturing companies make sense of all the data they collect. By tracking every aspect of manufacturing and shipping, the platform helps organizations identify weak spots, determine the root cause of workflow problems, and correct these issues.
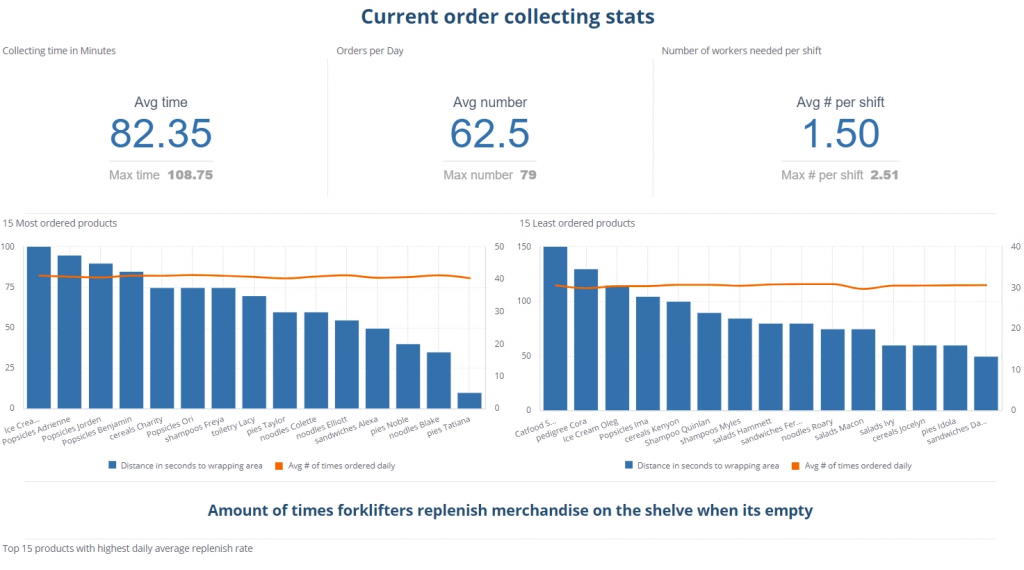
Sisense can help companies optimize warehouse operations and improve overall worker performance.
Sisense vs. Tableau Use Cases Takeaways:
- Sisense and Tableau offer different types of deployment: on-premise, your preferred cloud environment, public cloud, and managed cloud.
- The flexibility allows users to choose the best deployment for their organization’s needs.
- Both platforms also offer plenty of resources, including knowledge bases and user communities, for companies that are new to using the systems.
Sisense vs Tableau Comparison Table
| Sisense | Tableau | |
| Ideal for |
|
|
| Use cases |
|
|
| Core Features | ||
| Customizable data visualizations | ✓ | ✓ |
| Data integrations | ✓ | ✓ |
| Customized analytics | ✓ | ✓ |
| Trends and forecasting | ✓ | ✓ |
| Pre-built analytics templates | ✓ | ✓ |
| Data governance and security | ✓ | ✓ |
| Mobile apps | ✓ | ✓ |
| Key Integrations | ||
| Microsoft SQL Server | ✓ | ✓ |
| Amazon Redshift | ✓ | ✓ |
| Google BigQuery | ✓ | ✓ |
| Microsoft Excel | ✓ | ✓ |
| Pricing | ||
| Starts from | Custom Pricing | $12 per user/month |
| No. of plans |
1 |
For Teams and Organizations: 6 For individuals: 1 |
Sisense vs. Tableau—Which is Better?
The short answer is that the better software between these two choices is the one that best meets your needs. That said, Sisense and Tableau share many of the same features and capabilities. Both are business intelligence tools with user-friendly features for creating rich data visualizations and dashboards and gaining insights. As such, you can’t really go wrong with either platform.
However, there are certain differences between these two systems that you must consider. For instance, unlike Tableau, Sisense comes with built-in features for embedding dashboards into customer-facing applications. Sisense also has more customization options for developers, as its web-based interface and dashboards support JavaScript.
Meanwhile, compared to Sisense, Tableau offers more flexibility in terms of data governance models. This makes Tableau the ideal choice for organizations that plan to update their data governance policies over time.
Whichever business intelligence platform you choose, you’ll get a fully featured solution for gaining valuable insights into data and improving business performance. If you want to learn more about the advantages of using BI tools, check out our article on the benefits of using the best BI systems today.


Leave a comment!