
The year 2020 was, to say the least, volatile in the sense that investor confidence oscillated from deep lows to soaring highs. The S&P index witnessed a -33.9% drop from February 19 to March 23, 2020. This was the shortest bear market in history. Then, March 24 ushered a new bull market, closing in August of 2020 to the pre-pandemic range. However, the story is not the same across investment vehicles and markets.
In this article, we will get into the thick of the key investment statistics of 2020 and early 2021. With this, we hope you can update your outlook for this year and the next. Also, by pairing this knowledge with the use of top equity management software solutions, you just might be able to make better decisions going forward.

Investment Statistics Table of Contents
- General Investment Statistics
- Stocks and Mutual Funds Investment Statistics
- Fixed Income Investment Statistics
- Commodities Investment Statistics
- Cryptocurrency Investment Statistics
- Business Investments and Venture Capital Statistics
- Real Estate Investment Statistics
- Impact of Technology on Investments
General Investment Statistics
Contrary to what some people would expect, the personal savings rate in the country was up in 2020. With nothing much to do and nowhere to go, Americans got to save. However, COVID-19 had a lot of negative effects. Check out what happened in 2020 through these general investment statistics.
Historical Highs
- In 2020, the US inflation rate was 1.2%. This is a drop from 2018’s 2.4% and the previous year’s 1.8%. (BLS, 2021)
- The personal savings rate in the US in 2020 was 13.7%. This is the highest since 2012’s 12%. This is reminiscent of the 13.2% savings rate posted back in 1970. (St. Louis Fed, 2021)
- The value of personal savings in the US in 2020 was $2.32 trillion. This is almost double what was posted back in 2019 at $1.2 trillion. Moreover, this is the highest since 2012’s figure of $1.3 trillion. (St. Louise Fed, 2021)
- In COVID-stricken April 2020, the personal savings rate in the US reached 33.7%. This is the highest since the 17.3% posted in 1975. (St. Louis Fed, 2021)
Fluctuation in Personal Savings Rates
- Since March 22, 2020, there has been a relatively steady increase in household savings in the US because of the pandemic. Data found during that day indicate that only 8% of households saw their savings increase. Come December 11, 17% of US households claim that their savings have increased. The highest share of households that savings increased during the pandemic was 18% and that was on November 13. (Chemel et al., 2020)
- Most households in the US claim that the amount of savings in 2020 largely stayed the same. In March, about 48% of households attest to this. And, on December 11, the figure is at 47%. During the period, however, the lowest figure was at 45% recorded on May 25, and the highest share of 51% was recorded on July 20. (Chemel et al., 2020)
- On March 22, 44% of US households claimed that their savings decreased because of COVID-19. By December 11, the number dropped to 36%. During the period, the lowest share of households reporting this was recorded on July 20 at 31%. The highest recorded share of households reporting a decrease in savings was on March 22 and March 29 with 44%. (Chemel et al., 2020)
- In January 2020, the personal savings rate was only at 7.6%. The number shot up to 33.7% in April, largely due to the coronavirus. The figure later dropped to 13.4% in December 2020. (BEA, 2021)
- By January 2021, monthly personal savings were at $3.93 trillion. The personal savings rate for this month in the US was at a respectable 20.5%. (BEA, 2021)
Causes for Savings
- About 75% of financial advisors in the US in 2020 recommend to their clients to invest in liquid cash and equivalents. (MarketWatch, 2020)
- The top five activities that people miss out on, which caused them to save money in 2020 are vacations/trips (43%), major purchases like cars (34%), music/sports events (29%), eating out (28%), and childcare payments (28%). (TD Ameritade, 2020)
- Other reasons for significant savings include not going out for drinks (27%), not spending on fashion (23%), not going to a salon or spa, (21%), not attending a wedding (20%), and not commuting to work (18%). (TD Ameritade, 2020)
- The top five activities that people miss out on causing some savings are not spending on eating out (50%), clothing/fashion (50%), spa/beauty/salon (45%), coffee (39%), and drinking out (38%). (TD Ameritade, 2020)
- The average savings in 2020 because of not making major purchases like cars sit at $5,693. This is followed by not going on vacations or trips at $1,411. And, thirdly, $366 is saved on average for not paying for childcare. (TD Ameritade, 2020)
In this digital world, it is best to keep your finances in check using safe and trusted personal bookkeeping software tools. With these, you can not only keep track of your financial health but also plan for your future investments and retirement funds.
Retirement and Savings Statistics
Saving for retirement or a rainy day is one of the most important things that a person can do. Also, it is one of the most basic of all investments. So, there is really no excuse not to do it. And, there are many reasons why Americans do.
- The top five reasons for starting to save money for retirement are turning a certain age (29%), their employers offered a matching contribution (24%), their employers started paying for a plan (22%), saved for no particular reason (17%), and some were automatically enrolled by their employers (16%). (Aegon, 2020)
- Only 15% started saving money for retirement because they started a family. (Aegon, 2020)
- Other minor reasons for starting to save for retirement include starting their first jobs (12%), buying their first homes (9%), got separated/divorced (7%), getting married (7%), paying off student loans (6%), and losing their jobs (5%). (Aegon, 2020)
- The top five most popular accounts for retirement savings in the US in 2020 are regular savings account (55%), 401(k) plan (54%), Traditional IRA (20%), Roth IRA (19%), and Certificate of Deposit (19%). (T. Rowe Price, 2020)
- Around 18% of people in the US do not have an account for retirement savings. (T. Rowe Price, 2020)
Impact of COVID-19 on Retirement/Savings Plans by Generation
For people with no job prospects during the pandemic, there is no way to get by without taking a chunk from their personal savings. The situation provides legitimate reasons to withdraw from their emergency funds. Unfortunately, many Americans had to borrow against their retirement savings.
- Because of the pandemic, 26% of Millennials had to withdraw from their emergency fund/savings accounts. (TD Ameritade, 2020)
- Around 19% of Gen Xers had to withdraw from their emergency fund/savings accounts. (TD Ameritade, 2020)
- Only 10% of Boomers had to withdraw from their emergency fund/savings accounts because of COVID-19. (TD Ameritrade, 2020)
- Because of the pandemic, around 16% of Boomers had to delay their retirements. About 9% were forced to retire early. (TD Ameritade, 2020)
- Due to the coronavirus pandemic, 13% of Gen Xers and 15% of Millennials had to delay their retirements. (TD Ameritade, 2020)
- Only 7% of Boomers, because of the pandemic, had to borrow against their retirement savings. (TD Ameritade, 2020)
- About 9% of Gen Xers had to borrow against their retirement savings. For Millennials, the figure is around 14%. (TD Ameritade, 2020)
Where do Americans think they should invest their money?
- In 2020, people believe that the best long-term investments were Real Estate (35%), Stocks/Mutual Funds (21%), Gold (16%), Savings Accounts/CDs (17%), and Bonds (8%). (Gallup, 2020)
Of course, these are the public’s opinions. So, don’t take these as an investment statistic guide on where to put your money. These are just the prevailing beliefs of Americans. And, investment success does not really follow from taking on popular positions. On the other hand, there is safety in numbers. Just food for thought.
Source: Gallup, 2020
Stocks and Mutual Funds Investment Statistics
Stocks and mutual funds are the second most attractive investment vehicles for Americans in 2020. Stock trading has been around since 1602. Today, there are many exchanges worldwide. But, the US has the largest share in the world equity market. In the following subsection, we will look into some stock investment statistics by country.
Stock Investment Statistics by Country
- The oldest leading exchanges worldwide, as of April 2020, in years, are the Frankfurt Stock Exchange (434) New York Stock Exchange (227), the London Stock Exchange (218), the Madrid Stock Exchange (188), and the SIX Swiss Exchange (170). (Visual Capitalist, 2020)
- The US is the country with the largest share of total world equity market value with 55.9%. This is as of January 2021. (Credit Suisse, 2021)
- This is followed by Japan (7.4%), China (5.4%), UK (4.1%), and France (2.9%). This rounds out the top five countries. (Credit Suisse, 2021)
- The next six countries on the list are Switzerland (2.6%), Germany (2.6%), Canada (2.4%), Australia (2.1%), South Korea (1.8%), and Taiwan (1.7%). (Credit Suisse, 2021)
- As of January 2021, the largest stock operator is the New York Stock Exchange (NYSE) in the US. Its market capitalization of listed companies was reported to be at $24.49 trillion. (WorldAtlas & WFE, 2021)
- The NYSE is followed by another American-based exchange, the NASDAQ with a market cap of $19.34 trillion. (WorldAtlas & WFE, 2021)
- Shanghai Stock Exchange ($6.5tn), Hong Kong Exchanges ($6.48tn), and Japan Exchange Group ($6.35tn) round out the top five in the world when it comes to market cap. (WorldAtlas & WFE, 2021)
Healthy Domestic Equity Markets
Even though there was a significant dip in the first half of 2020 when it comes to capitalization, a rally was witnessed in the latter half of the year. In fact, trade volumes and the value traded worldwide were higher.
- In Q1 of 2020, there was a sharp drop by 20.7% and reached its pre-pandemic levels after the following months. (WFE, 2021)
- By November 2020, the markets added $10.90 trillion in capitalization. This surpassed the $100 trillion mark for the first time in history. (WFE, 2021)
- At the end of the year, an increase of 19.7% in capitalization was registered compared to the end of 2019. This reached a figure of around $109.21 trillion. (WFE, 2021)
- The year 2020 also witnessed a record-high level of value traded (53.7%) and volume traded (56.0%). These accounted for a total value traded of $137.3 trillion with 38.02 billion trades worldwide. (WFE, 2021)
- In the same year, a 1.1% increase in the number of companies listed was also seen compared to that of 2019. However, this is the lowest increase in the previous four years. (WFE, 2021)
- Individuals with high net incomes in 2019 allocated around 38.8% of their investments to equity instruments. (Capgemini, 2020)
Domestic Equity Markets Capitalization by Region
- All regions increased their capitalizations from 2019. In the Americas, 21.7% was posted. In APAC and EMEA, increases of 24.3% and 9.7% compared to the previous year were witnessed. (WFE, 2021)
- NASDAQ and NYSE registered an additional 12.5% and 46.6%, respectively. (WFE, 2021)
- In APAC, increases were also seen in the following markets: Shanghai Stock Exchange (36.6%), Hong Kong Exchanges and Clearing (25.1%), and Japan Exchange Group 8.5%. (WFE, 2021)
- The EMEA region also saw growth Deutsche Börse saw an 8.9% increase, SIX Swiss Exchange with a 9.1% increase, and Nasdaq Nordic and Baltic posted an increase of 30.9%. (WFE, 2021)
- During 2020, the APAC region leads when it comes to the number of IPOs. The fourth quarter of the year saw the largest number of IPOs at 324. The lowest quarter when it comes to IPOs was Q2 with only 123. (WFE, 2021)
Leading Global Unicorns Entering 2020
- The leading unicorns worldwide as of January 2020 were ANT Group ($125B), ByteDance ($75B), Infor ($60B), Didi Chuxing ($53B), and JUUL Labs ($50B). (Statista, 2020)
Americans and Stock Market Investment
Stock market investment is very popular in the US. For the most part of two decades, most Americans have stock market investments. With better access to digital tools for trading, the share of Americans with stocks will likely go further up in the future. Also, expect younger generations like Gen Z and Gen Alpha to join the fray.
- Since, 1999, the majority of US adults invest in the stock market. The base year recorded 58% of US adults with stock market investments. The year with the highest percentage of US adult investments was 2007 with 65%. (Gallup, 2020)
- The years with the lowest share of US adults that had stock market investments were in 2013 and 2016. Both recorded only 52%. (Gallup, 2020)
- For three straight years—2018 through 2019—the share of US adults with stock investments hover at 55%. (Gallup, 2020)
- The annualized real return on equities in the US from 2001 to 2020 was at 5.7%. (Credit Suisse, 2021)
- The Dow Jones Industrial Index (Dow) in 2020 reached 30,606.48. This is a significant increase in annual development from 28,538.44 in the previous year. (1Stock1.com, 2021)
- In 2020, the S&P 500 index reached 3,756.07. (Yahoo, 2021)
- As of January 2021, the largest IPOs in US history are Alibaba Group Holding in 2014 ($21.77B), Visa in 2008 ($17.86B), ENEL SpA in 1999 ($16.45B), Facebook in 2012 ($16.01B), and General Motors in 2010 ($15.77B). (Rennaisance Capital, 2021)
- The leading stock exchanges in the Americas by the number of listed companies are TMX Group in Canada (3,412), NASDAQ (2,987), and NYSE (2,873). (WFE, 2021)
- In 2020, 23% of men and 20% of women claim that stocks or mutual funds are the best long-term investments. (Gallup, 2020)
Mutual Funds Statistics
Mutual funds are seen as a safe bet when it comes to investing. People put a lot of trust in experts by letting them manage their money. Also, because the funds are pooled from different investors, risks are also shared. This is why many financial advisors recommend mutual funds as an investment.
- In 2020, 75% of financial advisors recommend non-wrap mutual funds as an investment vehicle. Only 30% recommend mutual fund wrap programs. (MarketWatch, 2020)
- In 2019, about 46.4% of American households owned mutual funds. This is the highest since 1980. (ICI, 2020)
- The number of mutual funds in the US in 2019 was 7,945. This is a drop from 8,094 in 2018. (ICI, 2020)
- The best mutual fund group in the world as of September 2020 is Black Rock Funds with assets of $7.08 trillion. (Mutual Fund Directory, 2020)
- This is followed by Vanguard ($5.7T), Charles Schwab ($4.28T), Fidelity Investments ($3.31T), and State Street Global Advisors ($3.15T). (Mutual Fund Directory, 2020)
- The top-performing global stock fund as of December 31, 2020, when it comes to one-year returns is Morgan Stanley Inst Advantage A with 94.46%. (Kiplinger, 2020)
- This is followed by Baron Global Advantage Retail (79.01%), Prudential Jennison Global Opportunities A (74.17%), ATAC Inflation Rotation Fund Investor Class Shares (72.51%), and Wasatch World Innovators Inv (67.92%). (Kiplinger, 2020)
Exchange Traded Funds (ETFs) Investment Statistics
- In 2020, the value of assets managed by ETFs reached $7.736 trillion. This is a sharp increase from 2019’s $6.194 trillion—a trend that continues since 2003. In 2003, the total value of assets being managed was only $204.3 billion. (ETFGI, 2021)
- The number of ETFs in 2020 was 7,602. This is an increase of 7.32% compared to 2020. (ETFGI, 2021)
- Moreover, this is a 2,654% growth since 2003 with only 276 ETFs worldwide. (ETFGI, 2021)
- The largest ETF when it comes to market capitalization as of February 4, 2021, is SPDR S&P 500 ETF Trust with $327.31 billion. (AssetDash, 2021)
- This is followed by iShares Core S&P 500 ETF ($241.01B), Vanguard Total Stock Market ETF ($207.92B), Vanguard S&P 500 ETF ($181.83B), and Invesco QQQ Trust ($153.71B). (AssetDash, 2021)
- In 2020, the number of assets under management or AUM by ETFs in North America reached $5.6 trillion. (TrackInsight, 2021)
- The number of AUM by ETFs in Europe in 2020 amounted to $1.3 trillion. (TrackInsight, 2021)
- In Asia, AUM by ETFs had a value north of $690 billion. (TrackInsight, 2021)
- The annual growth of total AUM by ETFs in North America in 2020 was 24.1% compared to 2019. (TrackInsight, 2020)
- The Asia Pacific posted a growth of 28.7% when it comes to AUM by ETFs in 2020. (TrackInsight, 2021)
- Europe also witnessed a 26.4% growth in AUM by ETFs in 2020. (TrackInsight, 2021)

Fixed Income Investment Statistics
Fixed-income investment vehicles are one of the safest ways to grow your money. Some even found that, in the long run, they may outperform stocks (Sommer, 2020). However, in 2020, bonds are not that popular among Americans. Maybe, the perception is that the returns are not just as good as other investment tools.
- In 2020, only 6% of men and 9% of women think that bonds are the best long-term investment vehicle. (Gallup, 2020)
- The year 2020 posted the lowest 10-year treasury securities yield from 1970 to 2020 with 0.89%. This is a drop from the 2018 and 2019 figures, which were 2.91% and 2.14%, respectively. The highest within this span was in 1980 with an 11.43% yield. (Federal Reserve, 2021)
- High net-worth individuals in North America in 2019 invest 17.5% in fixed income instruments. (Capgemini, 2020)
- In the US, the one-year return for core bonds was 7.5% in 2020. For high-yield bonds, the figure is at 7.03%. (Lynch, 2021)
- The one-year performance of bonds per sector is as follows: US Government (8.06%), Corporate (9.70%), and Mortgage (4.07%). (Lynch, 2021)
Fixed Income Investment Issuance Statistics
- In 2020, the total fixed income issuance was $12.171 trillion. (SIFMA, 2021)
- Mortgaged-backed securities lead in this category with an issuance of $4.243 trillion. (SIFMA, 2021)
- This is followed by Treasury Securities ($3.582T), Corporate Bonds ($2.279T), Federal Agency Securities ($1.275T), Municipal Securities ($483.9B), and Asset-Backed Securities 4($304.3B). (SIFMA, 2021)
- As of February 2021, Fixed Income Issuance reached $1.294 trillion. (SIFMA, 2021)
- Among fixed income issuances, Treasury Securities had the lion’s share with $473.5 billion. (SIFMA, 2021)
This is followed by Mortgage-Related Securities ($454.3B), Corporate Securities ($148.4B), Federal Agency Securities ($72.3B), Municipal Securities ($33.2B), and Asset-Backed Securities ($22.3B). (SIFMA, 2021) - Treasury Securities, because of the stress caused by the pandemic, is very low. The US 30-year yield reached 2.375% on March 5, 2021. Also, the US 20-year posted a figure of 2.283%. Moreover, the US 3-month yield sits at only 0.02%. (CNBC, 2021)
Fixed Income Outstanding
- Fixed income outstanding in 2020 was at a total of $49.842 trillion (SIFMA, 2021)
- From this total, Treasury Securities has the highest share of outstanding bonds with $19.898 trillion. (SIFMA, 2021)
- This is followed by Mortgage-Backed Securities ($11.214T), Corporate Bonds ($10.562T), Municipal Securities ($3.949T), Federal Agency Securities ($1.693T), Asset-Backed Securities ($1.535T), and Money Markets ($986.9B). (SIFMA, 2021)
The US Public Perception on Fixed-Income Instruments and Bonds
Sources: Capgemini, 2020; Gallup 2020
Designed byCommodities Investment Statistics
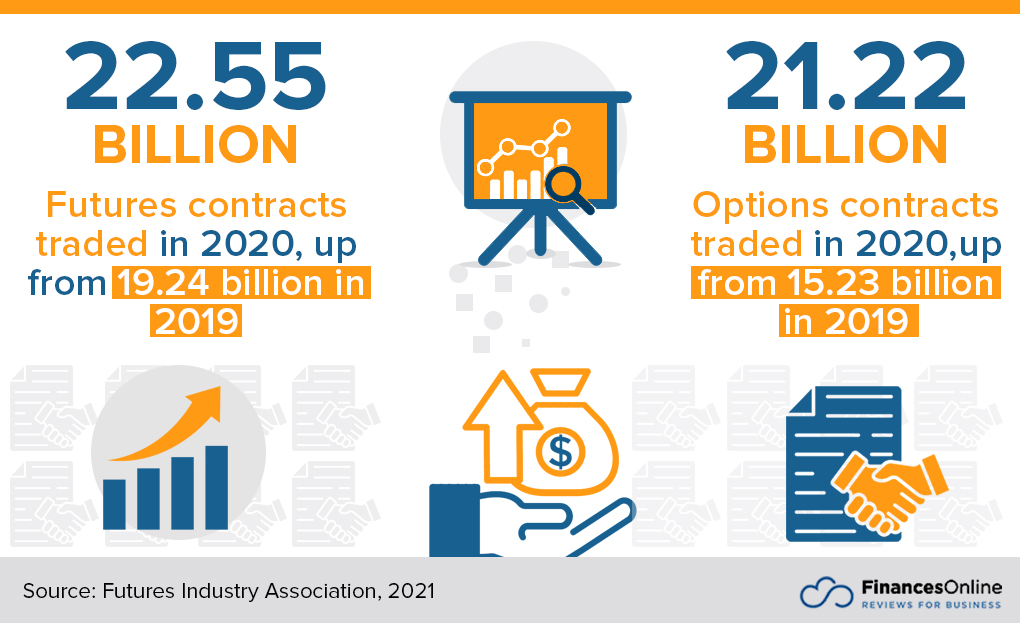
Commodities trading in 2020 has also witnessed an uptick. There were more futures and options traded than the previous year. When it comes to types, energy trading seems to be the most active. And, it is likely to stay this way in the future.
- In 2019, the number of future and options contracts traded globally were 19.24 billion and 15.23 billion, respectively. (Futures Industry Association, 2021)
- These numbers increased in 2020 when futures contracts traded rose to 25.55 billion and options contracts traded reached 21.22 billion. (Futures Industry Association, 2021)
- Since 1992, the consumer price index (CPI) of all urban consumers in the US has been skyrocketing. From 140.3 in 1992, it grew to 258.81 in 2020. (BLS, 2021)
- In 2019, the figure was 255.6 and grew by 1.23% in 2020. (BLS, 2021)
- From February 2020 to February 2021, the producer price index (PPI) for commodities was volatile. Starting from -4% from the base year, it reached a low of -8% in COVID-stricken April. Come February 2021, the figure sits at 6%. In the 12-month span, it was only in December that the figure was higher than zero (0.8%). (BLS, 2021)
- The commodity type that leads when it comes to the number of commodity futures and options contracts traded in 2019 was energy with 2.54 billion. This is followed by Agriculture (1.76B), Non-Precious Metals (1.43B), and Precious Metals (582.3M). (Futures Industry Association, 2019)
Average Gold Prices
- The demand for gold worldwide has historically been the biggest in the jewelry industry. In Q4 of 2020, the industry required 515.9 metric tons. This is followed by demands from investments (138.7t), technology (84t), and central banking and institutions (44.8t). (World Gold Council, 2020)
- Since 1990, average gold prices have been skyrocketing. Starting from $20.68 per oz t, it reached $1,392 in 2019. In 2020, the figure sits at $1,769.64. (Kitco, 2021)
- During the same period, 2020’s figure of $1,769.64 is the highest. It is an increase of $377.05 per oz t and by 27.07% from the previous year. (Kitco, 2021)
- The only other years when average gold prices surpassed the $1500 oz t mark were 2012 ($1,668.98) and 2011 ($1,571.52). (Kitco, 2021)
- Since 2015, the average gold prices grew by 52.51%. This was after the -43.53% fall from 2012. (Kitco, 2021)
Natural Gas Futures Statistics
- Since May of 2019, the Natural Gas Futures prices had an average price of $2.318. (Investing.com, 2021)
- In the same period, the lowest price was at $1.432 and the highest price was at $3.396. (Investing.com, 2021)
- During the same period, March and February 2020 had the lowest closing prices at $1.604 and $1.684, respectively. (Investing.com, 2021)
- Moreover, in the same span, October and November 2020 registered the highest closing prices with $3.354 and $2.882, respectively. (Investing.com, 2021)
- March 2021 closed with a price of $2.608 with a trading volume of 2.14 million and a -5.88% change. (Investing.com, 2021)
- This was after a slight increase starting January 2021 by 0.98% from December 2020 and February 2021 with an 8.07% change from January. (Investing.com, 2021)
Crude Oil Futures
- From May 2019 to April 2021, a 10.75% increase was registered in Crude Oil Futures prices. The figure started from $53.5 and ended up at $59.25 as of April 6, 2021. (Investing.com, 2021)
- In the same period, COVID-stricken April 2020 registered the lowest price with only $18.84. (Investing.com, 2021)
- In February 2021, the price was $61.5 with a month-on-month increase of 17.82%. This was the highest closing price in the aforementioned period. (Investing.com, 2021)
- March 2021, in the same period, registered the highest trading volume at 9.79 million. (Investing.com, 2021)
- During the same period, the highest price reached was $67.98 while the lowest price sits at -$40.32 with a difference of $108.3. (Investing.com, 2021)
- The average price in the same period is $47.72. (Investing.com, 2021)
Cryptocurrency Investment Statistics
Cryptocurrency is hot. It is not only the number of cryptocurrencies that’s rising but also the number of trades and the value of trades. In 2020, we have witnessed the surge of Bitcoin and Ethereum.
- In 2013, the number of cryptocurrencies worldwide was only 66. This skyrocketed to 644 in 2016. (Investing.com, 2021)
- By the end of 2017, the number of cryptocurrencies in the world broke the 1,000 barrier, reaching 1,335. (Investing.com, 2021)
- Since March 2018, the number of cryptocurrencies grew by 171.47% reaching 4,501 in 2020. (Investing.com, 2021)
- From 2013 to February 2021, the growth rate of the number of cryptocurrencies is a whopping 6719.7%. (Investing.com, 2021)
- The top five most expensive virtual currencies around the world as of March 29, 2021, are Wrapped Bitcoin ($58.122.85), Bitcoin ($58.046.64), Bitcoin BEP2 ($57,865.59), year.finance ($33,972.5), and Maker ($2,105.05). (CoinMarketCap, 2021)
Bitcoin (BTC) Statistics
- In October 2013, the Bitcoin price was at $196.02. (CoinDesk, 2021)
- The price reached a new peak in December of 2017 at $13,062.05. This is a 66,538.61% growth in a span of fewer than five years. (CoinDesk, 2021)
- The price reached a new peak in December of 2017 with a price of $13,062.05. This is a 66,538.61% growth in a span of fewer than five years. (CoinDesk, 2021)
- However, by September 2020, the price dropped to $10,764.28. But, this is the beginning of a steep climb to a whopping $46,642.61 in February of 2021. This is a 333.30% growth in just a span of months. (CoinDesk, 2021)
- As of March 30, 2021, the price of Bitcoin is $57,627.68. This is 435.36% growth from September 2020. (CoinDesk, 2021)
- Bitcoin market capitalization as of February 22, 2021, is over $1.01 trillion. (CoinMarketCap, 2021)
- As of March 27, 2021, the fee per Bitcoin transaction is $13.04. (Blockchain.com, 2021)
- Since its first block creation in 2009, Bitcoin’s current blockchain size is 390.52 GB. (BitInfoCharts, 2021)
Source: CoinDesk, 2021
Ethereum (ETH) Statistics
- As of March 30, 2021, the Ethereum price is at $1,809.07. (CoinMarketCap, 2021)
- In March of 2020, just a year before, the price of Ethereum was only $133.76. In one year, Ethereum price grew by 1252.47%. (CoinDesk, 2021)
- During March of 2020, Ethereum prices plummeted from the previous month’s $229.79. The COVID-stricken month registered a 71.79% drop. (CoinDesk, 2021)
- From then on, Ethereum prices soared starting from its April 2020 price of $215.2, breaking the $1,000 barrier by January 2021 with a price of $1,385.5. (CoinDesk, 2021)
- Despite the pandemic, the number of Ethereum transactions per day has been, generally, on the rise since January 2020. From a figure of 583.36 thousand to a high of 1.34 million on March 25, 2021. (BitInfoCharts, 2021)
- Today, Ethereum’s blockchain size is around 653.76 GB. (BitInfoCharts, 2021)
Cryptocurrency has been bullish in 2020. And, it just seems that it is becoming more and more of a good investment vehicle. If you want to learn more about its current state, you can check out these cryptocurrency statistics that we have compiled for you.
Business Investments and Venture Capital Statistics
One of the most popular investment options is to go into business or, well, invest in one. In 2020, however, as many doors were opened to food and delivery services, other business options were mostly closed. These include the hospitality and travel industries, among others.
US Business Start-Ups Statistics
- The number of business starts in Q1 of 2020 reached 280,000. (BLS, 2021)
- In the second quarter, because of the COVID-19 pandemic, the number of business starts dropped to 225,000. The number has not gone this low since Q3 of 2014, posting an almost identical count. (BLS, 2021)
- From a quarterly rate of business starts at 3.4% in Q1 of 2020, Q2 of 2020 posted only 2.7%. There has not been one this low since Q2 of 2010 with an identical figure. (BLS, 2021)
- Since 2014, the number of jobs created by start-ups that were less than one year old never went below the 3 million mark. (BLS, 2020)
- In 2020, 3,114,111 jobs were created by start-ups less than one year old. (BLS, 2020)
SME Debts Statistics
When it comes to debt, a significant portion of SMEs has them. And, the pandemic only made prospects of business or paying off these debts more difficult.
- Entering 2020, only 29% of SMEs in the US have no outstanding debt. (New York Fed & Philadelphia Fed, 2020)
- Around 16% of SMEs in the US have debts less than $25,000. (New York Fed & Philadelphia Fed, 2020)
- Only 5% of SMEs have debts over $1 million. (New York Fed & Philadelphia Fed, 2021)
If you are interested in the state of SMEs today, we have prepared a more comprehensive collection of small business statistics for you.
Global Foreign Direct Investments Statistics
Foreign direct investments (FDI) were also affected during the pandemic year. Investor confidence was very low, especially when different local economies reacted differently during the period.
- Global Foreign Direct Investments (FDI) dropped 50% in the first half of 2020 compared to the second half of 2019. This is to the tune of $364 billion. This is the lowest half-year figure since 2013. (OECD, 2020)
- The equity capital inflows in OECD areas fell by 68% as investors are reluctant to explore investment opportunities because of the pandemic. (OECD, 2020)
- A decrease by 20% was witnessed in outward FDI. Dividends fell by 23% while reinvested earnings dropped by 12%. (OECD, 2020)
- In the first half of 2020, there was a 12% decrease in completed merger and acquisition (M&A) deal values in advanced economies. (OECD, 2020)
Venture Capital Statistics
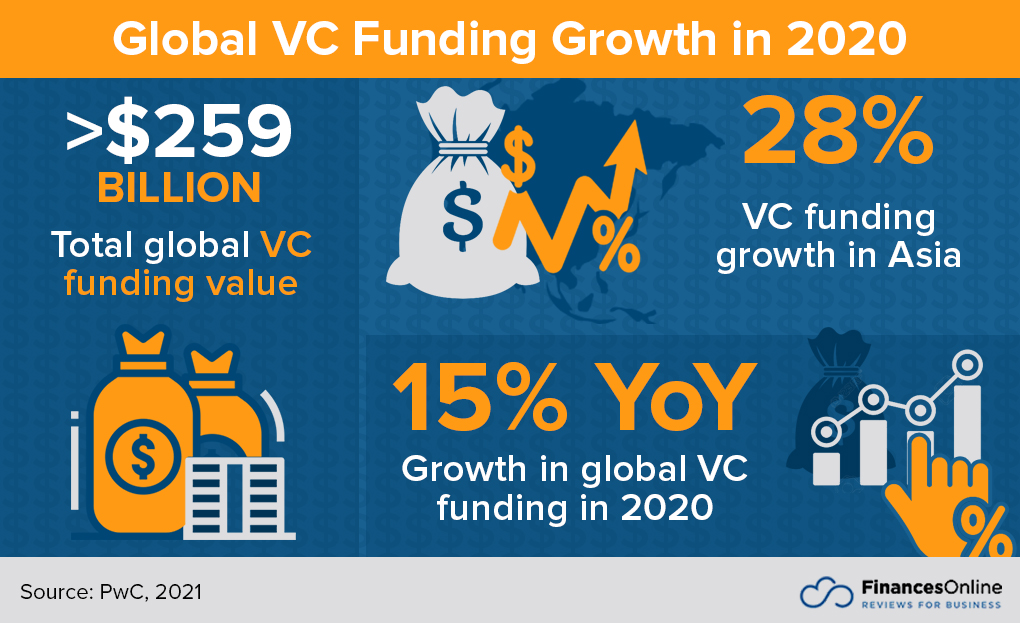
However, when it comes to VC funding, the world witnessed a sharp increase. One factor in this would be the rise of the tech industry, especially in a time where digital is the most prudent way to go. And, Asia had the largest growth registered.
- Global VC funding rose 15% YoY in 2020. The value reached over $259 billion. (Pwc, 2021)
- In 2020, Asia, Europe, and North America combined for a VC funding value of $259 billion. (PwC, 2021)
- Asia witnessed the greatest annual funding growth by 28%. (PwC, 2021)
- In 2020, funding in North America increased by 12% and funding in Europe increased by only 1%. (PwC, 2021)
- Despite the COVID pandemic, the value of venture capital investments in the US was at an unprecedented high at $130 billion. This is a 15% increase from 2019’s $113 billion. (PwC, 2021)
- Since 2010, the value of venture capital investments in the US grew by 398.08%. This is from $26.1 billion to 2020’s $130 billion. (PwC, 2021)
- The most recent biggest YoY growth was in 2018 with a then record-high $122 billion from 2017’s $79.2 billion. This is a whopping 54% growth in just one year. (PwC, 2021)
- The funding gains in 2020 were driven by mega-rounds with 318 rounds amounting to $100 million or more. (PwC, 2021)
- These mega-deals account for 49% of the total funding in 2020. (PwC, 2021)
- In 2020, there were 147 VC-backed tech company IPO exits. This is a sharp increase from the previous year’s 90. (PwC, 2021)
- However, M&A exits registered a decline by 3.98%, from 679 in the previous year to 653 in 2020. (PwC, 2021)
- Among Metro areas in the US, the Miami Metro registered the highest QoQ increase in investments with a 685% growth. (PwC, 2021)
- Other Metros with significant and noteworthy increases in investments are San Diego (298%), Denver (263%), and Atlanta (111%). (PwC, 2021)
- The top 3 VC-backed US tech start-ups by volume of equity funding are California’s JUUL Labs ($14.5B), Florida’s Magic Leap ($2.63B), and North Carolina’s Epic Games ($1.59B). (CB Insights, 2020)
Looking at the latest technology statistics, we can see that the fundamentals when it comes to the growth of technology businesses are stable. In the coming years, we should expect more and more companies to be put up to fill the growing demand. Thus, technology start-ups and related ventures will likely be good investments.
Real Estate Investment Statistics
About 35% of Americans believe that real estate is a great investment vehicle. And, in 2020, this was true depending on which sectors. One of those was the luxury housing market. Here are the latest statistics on the real estate industry.
- In pre-pandemic 2020, the most attractive sectors for investment purchase are Industrial (36%) and Multifamily housing (36%). About 11% of investors believe that Office space is the most attractive investment while only 9% and 3% are interested in Retail space and Hotel/Resorts, respectively. (CBRE Group, 2020)
- The YoY median sales price growth for affordable homes and luxury homes rose at a similar pace with 8.4% and 9%, respectively. (Katz, 2020)
- In Q2 of 2020, despite the surge in COVID cases, new home sales were up 43.2%. (Global Property Guide, 2020)
- An increase of 4.29% (up from 2019’s 3.25%) was registered on the S&P/Case-Shiller seasonally-adjusted national home price index. (Global Property Guide, 2020)
- In Q2 of 2020, house prices rose the most in the following cities: Phoenix (8.86%), Seattle (6.5%). Tampa (5.89%), Charlotte (5.74%), and Cleveland (5.4%). (Global Property Guide, 2020)
- Homeownership rates in the US have been generally on the rise from Q2 of 2016 with 62.9%. The year 2016 posted the lowest since Q2 of 1965 with the same figure. (FRED, 2021)
Homeownership was on the rise
- In Q1 of 2020, the US homeownership rate stood at 65.3%, registering a slight increase from Q4 of 2019’s 65.1%. (FRED, 2021)
- The second quarter of 2020 posted a high homeownership rate of 67.9%. (FRED, 2021)
- Homeownership rates dropped in the third quarter and fourth quarter of 2020 to 67.4% and 65.8%, respectively. (FRED, 2021)
- Millennials account for 38% of the homebuyer’s market in 2020. (NAR, 2020)
- About 88% of homebuyers aged 22-29 are first-time homebuyers. (NAR, 2020)
- Baby boomers account for 45% of the home sellers in 2020. (NAR, 2020)
Luxury Homes are in Vogue
- Luxury homes were hot investment opportunities in Q3 2020. There was a 2.3% YoY increase in the number of homes for sale and a 60.7% YoY increase in homes sold. (Katz, 2020)
- Expensive and mid-priced homes also registered an increase of 30.3% and 14.8% growth in sales, respectively. (Katz, 2020)
- The median sales price of luxury homes sat at $899,000 while that of expensive homes was $412,000. (Katz, 2020)
- The listing of expensive homes increased by 6.5% and luxury homes by a considerable 31.5%. (Katz, 2020)
- In Q3 of 2020, all 49 most-populous metropolitan areas in the US witnessed a double-digit growth at the least when it comes to luxury home sales. (Katz, 2020)
- The cities with the highest YoY increase in luxury home sales are Newark, NJ (101.%), West Palm Beach, Florida (97.1%), San Antonio, TX (82.4%), Riverside, CA (80%), and Jacksonville, FL (80%). (Katz, 2020)
Commercial Real Estate Investment Statistics
- Retail vacancy rates soared from Q1 to Q2 2020 from 9% to 20%. (NAR, 2020)
- The COVID-19 pandemic made consumers very unlikely to visit brick-and-mortar stores. Around 74.6% of consumers are likely to avoid shopping centers or malls, while 52.7% avoid shops in general. (eMarketer, 2020)
- Office space vacancy rates also skyrocketed from 9% in Q1 of 2020 to 15% in Q2. (NAR, 2020)
- The upsurge in office space vacancy rates is largely due to workers preferring to work remotely because of COVID-19. Around 40% want to work remotely. (Herhold, 2020)
- The industrial vacancy rate in the US increased from 5% in Q1 of 2020 to 5.3% for Q2 and Q3. (NAR, 2021)
- The average rent per square foot for special purpose industrial space is $8.47. (NAR, 2021)
- For manufacturing spaces, the average rent per square foot is $6.71. (NAR, 2021)
- Rent per square foot for warehouses and distribution reached an average of $6.34. (NAR, 2021)
- Worldwide, the revenue loss from business travel spending reached $810.7 billion. China took the brunt with almost half of these losses with $404.1 billion. North America lost $63.5 billion, Europe by $190.5 billion, and Asia Pacific by $120 billion. The Middle East also registered a loss of $18.1 billion and Latin America with $17.6 billion. (Global Business Travel Association , 2020)
Year-on-Year Growth in Homes Sold in 2020 by Type
Q3 of 2020
Source: Redfin, 2020
Designed byMany people are in a hurry to get over the COVID-19 hump. And, it is easy to hope that the economy is recovering faster than it is. However, it might be too hopeful to think that by the second half of 2020, the market will be back to pre-pandemic levels. So, it might be best to hold out on some real estate investments until the market has normalized. To get to know more about the market, you can check out the latest real estate statistics.
Impact of Technology on Investments
Technology has significantly transformed the investment landscape in recent years. With innovations such as artificial intelligence (AI), blockchain, and fintech, new opportunities and challenges have emerged for individual and institutional investors.
- AI and Machine Learning: AI and machine learning algorithms are now commonly used to analyze vast amounts of data and make investment decisions. These technologies allow investors to identify patterns and trends that would be difficult for humans to detect. Robo-advisors, powered by AI, have also made investing more accessible, offering low-cost, personalized investment strategies.
- Blockchain and Cryptocurrencies: Blockchain technology, which underpins cryptocurrencies like Bitcoin and Ethereum, has disrupted traditional investment models. It has introduced decentralized finance (DeFi) platforms that allow users to engage in financial activities without relying on centralized intermediaries such as banks. The rise of cryptocurrencies has attracted investors seeking high-risk, high-reward opportunities.
- Fintech Innovations: The emergence of fintech platforms has democratized investment opportunities, mainly through crowdfunding, peer-to-peer lending, and micro-investing apps. These technologies allow users to invest with minimal capital, providing access to asset classes like real estate and startups that were once reserved for high-net-worth individuals.
- Trading Platforms and Automation: New online trading platforms, often integrated with AI-driven tools, have made investing easier and faster. With automated trading bots and algorithm-based decisions, investors can execute real-time transactions, minimizing human error and improving efficiency.
A Boom after the bust?
As this investment statistics guide shows, the economy has been adapting to the new normal with various public and corporate policies like remote work trends and other health protocols. And, many people feel that we are due for a boom after the pandemic is over. Fortunately, the current picture seems to be bright. Recovery seems to be in sight, however far it may seem.
As of March 8, 2021, more than two million Americans have been receiving the vaccine (Pickert, Qui, & McIntyre, 2021). States have been reopening. For five weeks straight from February to early March, job postings have accelerated. Moreover, restaurant bookings have also increased. With consumer spending up, the economy is trying hard to get past the woes brought about by the COVID-19 pandemic.
There are also many positive signs. As Pickert, Qui, and McIntyre (2021) added, there are other parts of the economy that have returned or even surpassed pre-pandemic levels. Indicators show that total sales are the strongest with the housing market growing in full stride.
Many believe, and many more hope, that this growth will be consistent across industries. In December 2020, the Organization for Economic Cooperation and Development (OECD) forecast the global economy to grow by 4.2% in 2021 after it had shrunk by 4.2% in 2020 (Voice of America, 2020).
And, in March 2021, Tomlinson pointed out that experts feel that the US GDP will grow by 4% to 6.5%. The last time that the yearly GDP broke past the 4% level was in 2000 with the internet boom. Bullish investors will keep an eye on and will be ready to pounce on new opportunities.
The case, however, is not settled. Recovery is still not in full swing. But, if we just look at the signals from key indicators, the economy is on its way to recovery, however slowly. The answer to the question of how soon the recovery is going to be will depend on how we handle the current COVID cases and the reopening of local economies.
Key Insights
- Volatility in 2020: The year 2020 saw significant fluctuations in investor confidence, with the S&P index experiencing a dramatic drop of -33.9% followed by a rapid recovery, marking the shortest bear market in history.
- Rise in Personal Savings: Despite economic challenges, the personal savings rate in the US increased significantly, reaching a high of 33.7% in April 2020, with the total value of personal savings doubling from 2019 to $2.32 trillion in 2020.
- Investment Preferences: Real estate remained the most favored long-term investment for Americans in 2020, followed by stocks, mutual funds, and gold.
- Stock Market Resilience: The US stock market showed resilience with a significant increase in market capitalization and trading volumes by the end of 2020, surpassing $100 trillion for the first time.
- Cryptocurrency Surge: Cryptocurrencies, particularly Bitcoin and Ethereum, saw remarkable growth in value and adoption, with Bitcoin’s price increasing by 435.36% from September 2020 to March 2021.
- Venture Capital Growth: Global venture capital funding rose by 15% in 2020, driven by the tech industry, with significant increases in Asia and the US.
- Real Estate Investment Trends: The luxury housing market experienced a notable surge in sales and prices, while commercial real estate sectors like office and retail spaces faced higher vacancy rates due to the pandemic.
FAQ
- How did the S&P index perform in 2020?
The S&P index saw a -33.9% drop from February 19 to March 23, 2020, marking the shortest bear market in history. However, it quickly rebounded, entering a bull market on March 24 and returning to pre-pandemic levels by August 2020. - Why did the personal savings rate increase in 2020?
The increase in the personal savings rate was primarily due to the reduced spending opportunities caused by COVID-19 restrictions. People saved money on activities such as vacations, dining out, and major purchases, leading to a savings rate of 33.7% in April 2020. - What were the most popular long-term investments for Americans in 2020?
In 2020, real estate was considered the best long-term investment by 35% of Americans, followed by stocks/mutual funds (21%), savings accounts/CDs (17%), and gold (16%). - How did the US stock market fare in 2020 despite the pandemic?
The US stock market showed remarkable resilience, with market capitalization and trading volumes increasing significantly. By November 2020, the market added $10.90 trillion in capita
lization, surpassing $100 trillion for the first time. - What trends were observed in the cryptocurrency market in 2020?
Cryptocurrencies experienced substantial growth in 2020. Bitcoin’s price soared from $10,764.28 in September 2020 to $57,627.68 by March 2021. Ethereum also saw a significant price increase, growing by 1252.47% from March 2020 to March 2021. - How did venture capital funding change in 2020?
Global venture capital funding increased by 15% in 2020, reaching over $259 billion. This growth was driven by the tech industry, with Asia witnessing the highest annual funding growth of 28%. - What impact did the pandemic have on commercial real estate?
The pandemic led to increased vacancy rates in commercial real estate sectors such as office and retail spaces. Retail vacancy rates rose from 9% in Q1 2020 to 20% in Q2, and office space vacancy rates increased from 9% to 15% over the same period. - What changes occurred in the luxury housing market in 2020?
The luxury housing market saw a significant rise in sales and prices. There was a 60.7% year-over-year increase in luxury homes sold in Q3 2020, with the median sales price of luxury homes reaching $899,000.
References:
- 1Stock1. (2021). Dow Jones industrial average (DJIA) yearly returns. 1Stock1.
- Aegon. (2020). Aegon retirement readiness report 2020. Aegon Group Corporate Website Aegon.
- Ameritrade. (2020, May). Covid-19 & finances survey: Impact of the Covid-19 pandemic on Americans’ finances and spending habits. Ameritrade.
- AssetDash. (2021). Top Assets by Market Cap. AssetDash.
- BEA. (2021). National Income and Product Accounts. BEA: Data Tools. BEA.
- BitInfoCharts. (2021). Ethereum / Ether (ETH) statistics – Price, blocks count, difficulty, Hashrate, value. BitInfoCharts.
- BitInfoCharts. (2021). Ethereum transactions chart. BitInfoCharts.
- Blockchain.com. (2021). Fees-USD-per-transaction. Blockchain.com.
- Bureau of Labor Statistics. (2021, April 9). Producer Price Index – March 2021. U.S. Bureau of Labor Statistics. BLS.
- Bureau of Labor Statistics. (2021). Table 8. Private sector establishment births and deaths, seasonally adjusted. BLS.
- Bureau of Labor Statistics. (2021). Table 6. Private sector employment by establishment age. BLS.
- Bureau of Labor Statistics. (2021). CPI home: U.S. Bureau of Labor Statistics. U.S. Bureau of Labor Statistics. BLS.
- Capgemini. (2020, July 7). Asset allocation. World Wealth Report. Capgemini.
- CB Insights. (2021, March 24). The United States of startups: The most well-funded tech startup in every US state. CB Insights Research. CB Insights.
- CBRE Group. (2020). Most attractive property sectors for investment purchase in the Americas from 2017 to 2020. CBRE Group.
- Chemel, N., Das, R., Euart, J., Gordon, J., Panek, M., & White, O. (2020, December 21). Financial decision-maker sentiment: US. McKinsey & Company.
- CNBC. (2021). Bonds. CNBC.
- CoinDesk. (2020, July 15). Bitcoin price index — CoinDesk 20. CoinDesk.
- CoinDesk. (2021, April 8). Ethereum price index — CoinDesk 20. CoinDesk.
- CoinMarketCap. (2021). Today’s cryptocurrency prices by market cap. CoinMarketCap.
- CoinMarketCap. (2021). Bitcoin price today, BTC live marketcap, chart, and info. CoinMarketCap.
- Credit Suisse. (2021). Credit Suisse global investment returns yearbook 2021 summary edition. Credit Suisse.
- Desjardin, J. (2019, March 11). The 20 largest stock exchanges in the world. Visual Capitalist.
- EMarketer. (2020, February 28). US internet users who are likely to avoid stores if the coronavirus outbreak worsens in the US, by age, Feb 2020 (% of respondents in each group). Insider Intelligence. eMarketer.
- ETFIG. (2021). ETFGI reports assets in the global ETFs and ETPs industry which will turn 30 years old in March started the new decade with a record 6.35 trillion US dollars. ETFGI LLP.
- Federal Reserve. (2021). Market yield on U.S.Treasury securities at 10-year constant maturity, quoted on investment basis. Federal Reserve.
- FRED. (2021, March 26). Personal saving rate. Economic Research – St. Louis Fed. FRED.
- Futures Industry Association. (2019). FIA releases annual trading statistics showing record ETD volume in 2018. FIA.
- Futures Industry Association. (2021). Global futures and options trading reaches record. Markets Media.
- Gallup. (2020, April 24). Stock investments lose some luster after COVID-19 sell-off. Gallup.com.
- Gallup. (2020). Stock market. Gallup.com.
- Gallup. (2020). Gallup poll social series: economy & personal finances. Gallup News.
- Global Business Travel Association. (2020, March 10). New GBTA research shows coronavirus continues to impact the business travel industry. GBTA.
- Global Property Guide. (2020, October 1). U.S. house prices continue to rise, albeit at a slower pace. GPG.
- Herhold, K. (2020, April 16). Preference to work in office or from home 2020. Clutch.
- ICI. (2020). Investment company fact book 60th edition. ICI.
- Investing.com. (2021). Natural gas futures historical prices. Investing.com.
- Investing.com. (2021). Crude oil WTI futures historical prices. Investing.com.
- Investing.com. (2021). All cryptocurrencies. Investing.com.
- Katz, L. (2020, December 22). Luxury home sales soar record 61%, quadrupling pre-pandemic growth. Redfin Real Estate News.
- Kitco. (2021). Historical gold charts and data – London fix. Live Gold Prices | Gold News And Analysis | Mining News | KITCO.
- Lynch, K. (2021, January 5). 2020 market performance in 7 charts. Morningstar, Inc.
- MarketWatch. (2020). 2020 Trends in Investing Survey. Let’s Change Tomorrows™. Let’s Start Today. | Financial Planning Association.
- Mutual Fund Directory. (2020). Top 100 mutual fund companies ranking – December 2021 – Mutual fund directory 2021. Mutual Fund Company Directory.
- National Association of Realtors. (2020, March 5). 2020 Home buyers and sellers generational trends report. NAR.
- National Association of Realtors. (2020). Commercial real estate trends & outlook. NAR.
- New York Fed, & Philadelphia Fed. (2020). Small Business Credit Survey. Fed Small Business.
- OECD. (2020). FDI in Figures. OECD.
- Pickert, R., Qui, Y., & McIntyre, A. (2020, September 28). U.S. continues gradual recovery though risks remain. Bloomberg.com.
- Price, T. R. (2020, December). T. Rowe price’s 12th annual parents, kids & money survey. SlideShare.
- PwC. (2021). MoneyTree Report Q4 2020. PwC: Audit and assurance, consulting and tax services. PwC.
- Renaissance Capital. (2021). Largest US IPOs. Renaissance Capital.
- SIFMA. (2021). Fixed income chart. SIFMA.
- Sommer, J. (2020, May 1). Bonds beat stocks over the last 20 years. The New York Times.
- St. Louis Fed. (2021, March 25). Personal saving. St. Louis Fed.
- Statista. (2020, January 15). Highest valued unicorn companies globally 2020. Statista.
- Tomlinson, C. (2021, March 26). Tomlinson: Economy bouncing back from COVID, but will be different from before times. Houston Chronicle.
- TrackInsight. (2021, January 8). ESG ETF assets surge three-fold in record-setting 2020 for ETFs. TrackInsight.
- The World Federation Exchanges, & WorldAtlas. (2021). Welcome to the future of markets | The World Federation of Exchanges.
- The World Federation of Exchanges, & WorldAtlas. (2021). Market statistics – Focus | The world Federation of exchanges. Focus Issue 48: April 2021 | The World Federation of Exchanges.
- Voice of America. (2020, December 1). World economy will bounce back in 2021, OECD says. VOA.
- World Gold Council. (2020). Gold demand by country | Gold demand and supply statistics | Goldhub.
- Yahoo. (2021). S&P 500 (^GSPC) historical data. Yahoo Finance.


Our Focus is Silver. We unlock previously unrecognized value. Silver is a small part of the global market. Although we favor producing assets (we are targeting 50% of our invested capital be deployed into producing mines or facilities), we appreciate the need for capital in the industry as well as the ability to secure future new production through development (3-5 years to production at 30% of invested capital), and exploration (20% of IC) royalties.
Leave a comment!