
The food and beverage industry was shaken with the onset of COVID-19. A large number of restaurants in the United States closed while many of those that stayed open incurred losses. This spurred restaurateurs to get creative and find ways to operate through a challenging time. As a result, food deliveries flourished, more tech came into use, and social media became an even bigger marketing platform.
Now, the restaurant industry is in the process of recovery and is bound to reach pre-pandemic returns soon. As most economies have reopened, diners have flocked back to their favorite dining spots. However, some norms have changed, like the heavy use of food delivery apps, the current popularity of contactless methods, and the use of restaurant management software. So how will restaurants fare in the coming years?
This restaurant industry overview presents the latest restaurant software statistics and industry news, accounting for the industry’s market size, technology, and marketing efforts. It also sheds light on consumer behavior and dining preferences. Restaurant owners and marketers can leverage the data to meet or even exceed their aims.

Restaurant Software Statistics Table of Contents
State of the Restaurant Industry Statistics
The restaurant industry bounced back in 2021 after being hit hard by the pandemic in 2020. Due to the rise of vaccination rates and the desire to regain pre-pandemic normalcy, people dined out and socialized. Restaurants, on the other hand, made strategic investments and added new menu items to entice diners. The job outlook for bar and restaurant workers was promising as well, shooting up 17%, which is far higher than the national average.
- Foodservice makes up 40% to 50% of total food spending in the US, but this range goes down to 10% to 15% in developing countries (Global Industry Analysts, 2021).
- Almost six out of seven restaurants made new investments in 2021 (Square, 2021).
- One in four restaurants adopted online ordering (Paytronix, 2021).
- Moreover, 50% of restaurants added new products and/or services due to the pandemic (Square, 2021).
- The median pay of workers in the food and beverage industry is $24,130 per year or $11.60 per hour (US Bureau of Labor Statistics, 2021).
- In addition, the job outlook for restaurant employees from 2020 to 2030 is at 17%, higher than the national average of 8% (U.S. Bureau of Labor Statistics, 2021).
- As of August 2021, a larger share of adults had food delivered or picked up an order to go than those who dined in restaurants for breakfast (31% vs 19%), lunch (43% vs 28%), and dinner (60% vs 48%) (National Restaurant Association, 2021).
- Also, as of April 2021, 57% of all restaurants, 61% of full-service establishments, and 53% of limited-service restaurants in the US offer on-premise outdoor dining (National Restaurant Association, 2021).
- Furthermore, 26% of food businesses see themselves as tech-forward after the onset of the pandemic (Panasonic, 2020).

Restaurant Industry Revenue Statistics
The restaurant industry is on track to reach pre-pandemic numbers should its progress not be stifled. According to latest global restaurant industry statistics, the worldwide restaurant market is projected to grow by 5.4% through 2026. The US restaurant industry also reflects the same trend. Although it didn’t reach its pre-pandemic food and beverage sales of $864.3 billion in 2019 (National Restaurant Association, 2021), its total sales grew from $659 billion in 2020 to $789 billion in 2021.
- The global food service industry’s projected worth was $3 trillion in 2020 and is expected to reach $4.1 trillion by 2026, with an annual growth rate of 5.4% (Global Industry Analysts, 2021).
- Meanwhile, the food and beverage sales of the US food service industry reached $789 billion in 2021, accounting for a 19.7% growth over the previous year (National Restaurant Association, 2021).
- In addition, the limited-service restaurant segment in the US made $339 billion in 2021 while the full-service segment earned $255 billion (National Restaurant Association, 2021).
- Furthermore, the projected sales of eating and drinking places increased from $548 billion in 2020 to $609 billion in 2021 (Restaurant Dive, 2021).
- The branch of the US restaurant industry that posted the largest growth in 2021 is bars and taverns with a 94.8% increase in sales from 2020 (National Restaurant Association, 2021).
- In the first week of December 2021, the U.S. restaurant industry experienced a 7% year-on-year average check growth (Black Box Intelligence, 2021).
- As of March 2021, the restaurants with the highest brand value are Starbucks ($38.44 billion), McDonald’s ($33.838 billion), KFC ($15.071 billion), Subway ($8.181 billion), Domino’s ($6.089 billion), Taco Bell ($5.809 billion), Dunkin’ ($5.741 billion), Pizza Hut ($5.13 billion), Haidilao ($4.523 billion), and Tim Horton’s ($4.054 billion) (Brand Finance, 2021).
Source: National Restaurant Association 2021
Statistics on the Behavior of Restaurant Goers
With the pandemic confining or limiting the mobility of people, consumer behavior towards food had a significant shift. All of a sudden, deliveries became the method of choice to procure food. Moreover, dining preferences changed. The latest restaurant and restaurant software statistics reveal that more diners prefer contactless processes as well as sustainable packaging.
- On average, delivery customers spend 21% more than takeout customers (Paytronix, 2021).
- The top reason for guests to return to a restaurant is food quality, with 50% of customers citing it as an important factor, followed by attention to cleanliness and safety (43%), value (31%), menu options (27%), and the desire to support local businesses (22%) (Toast, 2020).
- 32% of adults diners are less likely to dine in a restaurant if masks are required to eat inside (National Restaurant Association, 2021).
- In addition, 84% of adult diners prefer it if restaurants set up outdoor dining areas (National Restaurant Association, 2021).
- Remarkably, 83% of young consumers do not mind paying a little more for sustainable packaging (Trivium Packaging, 2021).
- Moreover, 67% of consumers think that packaging recyclability is important (Trivium Packaging, 2021).
- In lieu of this, 58% of consumers are more likely to buy food items whose packaging clearly states that it’s reusable or recyclable (Food Dive, 2020).
- Unsurprisingly, 53% of adult consumers say that buying delivery or takeout is necessary to their current lifestyle (National Restaurant Association, 2021).
- Furthermore, 79% of customers prefer to transact through online kiosks more than with humans and 78% would rather order through a QR code (Square, 2021).
- One in three diners is less likely to visit a restaurant if proof of being vaccinated is required. On the other hand, 33% of diners say that proof of vaccination inspires confidence in visiting restaurants (QSR, 2021).

Food Delivery Statistics
As mentioned previously, the restaurant industry saw an unprecedented increase in digital orders after the onset of the pandemic. In December 2020, sales from online orders increased by a staggering 452% from what they were prior to the COVID-19 pandemic. In addition, recent restaurant software statistics reveal that food delivery apps are gaining more ground, with Door Dash and Uber Eats leading the charge.
- There was a 313% increase in sales from digital ordering platforms after the onset of the pandemic, and by December 2020, the increase in online sales reached 452% (Payronix, 2021).
- In addition, consumers, on average, spend 10% more on delivery orders than takeouts (Paytronix, 2021).
- In December 2020, 90% of food deliveries were made to homes or offices, 28% were collected from the store, and 23% were picked up at the store’s curbside (eMarketer, 2021).
- Moreover, the number of food app delivery users in the US increased from 36.4 million in 2019 to 44.1 million in 2021. It is projected to reach 53.9 million by 2023 (eMarketer, 2020).
- Meanwhile, Door Dash accounts for the highest share of delivery sales in the US at 57%, followed by Uber Eats (24%), Grubhub (15%), and Postmates (3%) (Bloomberg Second Measure, 2021).
- Door Dash also has the highest quarterly customer spend at $302 per customer, followed by Uber Eats ($229), Grubhub ($153), and Postmates ($145) (Bloomberg Second Measure, 2021).
- 65% of online orders in May 2020 were from first-time customers to a brand (Paytronix, 2021).
- Interestingly, 68% of consumers prefer to place delivery orders from a food establishment’s website (Square, 2021).
- The quality of food delivered is the factor in food deliveries that customers care about the most with 65% citing it as an important factor, followed by ease of ordering (50%), attention to cleanliness and safety (48%), value (48%), and speed (45%) (Toast, 2020).
Leading Food Delivery Apps in the U.S. by Share of Monthly Delivery Sales
Door Dash: 57
Door Dash
%Uber Eats: 24
Uber Eats
%Grubhub: 15
Grubhub
%Postmates: 3
Postmates
%Others: 1
Others
%Source: Bloomberg Second Measure 2021
Designed byCurbside Pickup Statistics
Food delivery isn’t the only aspect of dining that posted huge gains in 2020 and 2021. There was a sharp increase in the number of restaurants in the US that offer curbside pickup options, with the usage rate in North America rising by a stellar 190%. As such, U.S. buyers have come to expect their favorite stores and restaurants to offer the option.
- The sales from click-and-collect schemes in the US are projected to increase from $35.02 billion in 2019 to $83.47 billion in 2021, eventually reaching $140.96 billion in 2024 (eMarketer, 2021).
- In addition, the usage of curbside pickups in North America rose by 190% during the pandemic, outpacing the global average growth of 159% (Astound Commerce, 2021).
- As of August 2020, 43.7% of the 245 top retailers offer curbside pick-up options, which represents a 36.8% increase from the previous year (Digital Commerce 360, 2021).
- Additionally, 39% of US retailers introduced the curbside pick-up option during the pandemic, of which 74% will keep after COVID (Retail Brew, 2021).
- As a result, 69% of US buyers expect retailers to offer curbside pick-up and 71% expect the buy-online-pickup-in-store to be available (CSA, 2021).
- Moreover, 69% of US consumers have used curbside pick-up since the beginning of the pandemic (CSA, 2021).
Online Food Delivery Revenue Statistics
An increase in food deliveries means higher sales for food businesses, and these gains are massive. If we look at restaurant industry statistics in 2022, the revenue from online food deliveries is set to increase by $41.836 billion for that year. With this, the market size of ghost kitchens, a related industry, has also grown considerably.
- From a value of $80.37 billion in 2020, the global online food delivery market is projected to reach $128.5 billion by 2027, with an annual growth rate of 6.5% (Valuates Reports, 2021).
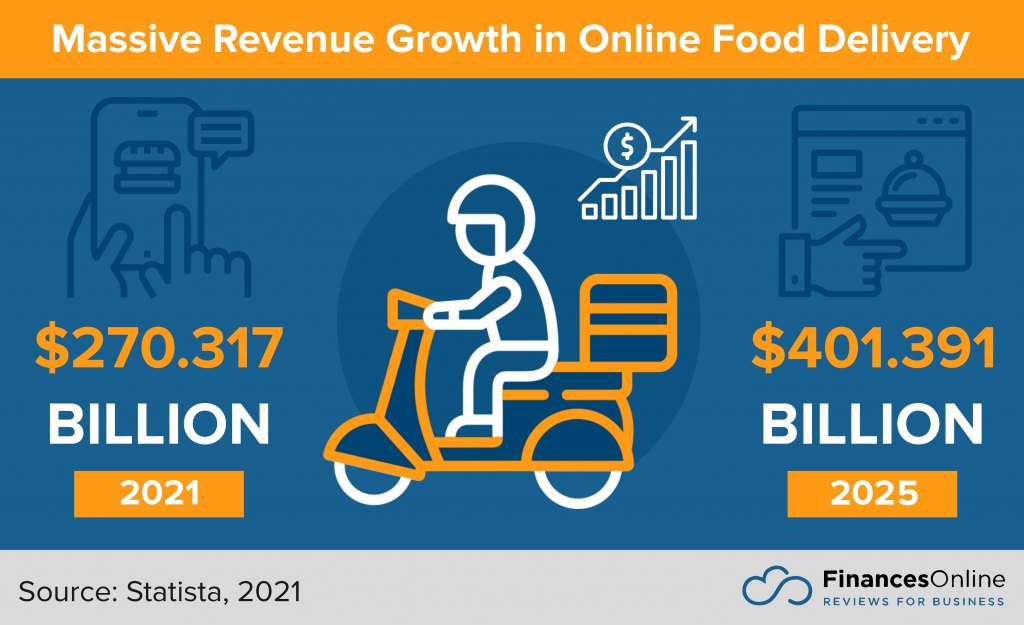
- Moreover, a report from Statista puts the global revenue of online food delivery at $270.317 billion in 2021, projected to reach $312.153 billion in 2022 and $401.391 billion by 2025 (Statista, 2021).
- Delving further, the $270.317 billion revenue in 2021 was composed of $148.358 billion in revenues from platform-to-consumer deliveries and $121.958 billion in revenues from restaurant-to-consumer deliveries (Statista, 2021).
- The country projected to account for the highest revenues of online food delivery in 2022 is China with an estimated $181.776 billion, followed by the US ($34.256 billion), India ($14.408 billion), the United Kingdom ($13.489 billion), and South Korea ($7.799 billion) (Statista, 2021).
- Meanwhile, the country with the highest online food delivery penetration is Denmark at 61.1%, followed by China (58.7%), Netherlands (53.8%), Canada (50.7%), and Finland (49.9%) (Statista, 2021).
- As for cloud or ghost kitchens, their market value is projected to increase from $43.1 billion in 2019 to $71.4 billion by 2027, with an annual growth rate of 12% (Valuates Reports, 2021).
Food Order Statistics
It comes as no surprise that sales from online food orders have outpaced their in-store counterparts. What’s surprising is the choice of meals besides usual go-tos like pizzas and burgers. For instance, sandwiches and seafood had sharp increases in orders in 2020. In a way, this could signify that people are practicing healthy living amid the pandemic.
- Digital orders account for 28% of all orders (Paytronix, 2021).
- Also, the number of online food orders in fast-food and casual dining restaurants is 50% larger than non-digital orders (Paytronix, 2021).
- 32% of consumers observed healthier eating habits in 2020 (International Food Information Council, 2020).
- Surprisingly, there was a 149% increase in the appearance of fermented foods on Upserve menus (Upserve, 2020).
- In addition, over 50% of customers would buy a meal kit if it is offered by their favorite restaurants. This percentage shoots up to 75% for millennials and Gen Z adults (National Restaurant Association, 2021).
- 50% of consumers are merely likely to prepare their own food since the pandemic (International Food Information Council, 2020).
- In 2020, the food items with the biggest increase in online orders were sandwiches and wraps (21%), burgers (10%), pizza (9%), salad (7%), and seafood (6%) (Upserve, 2020).
- Meanwhile, for dine-in menus, the biggest increase was from seafood at 17%, followed by sandwiches and wraps (14%), steak (8%), salad (7%), pasta (6%), and burgers (6%) (Upserve, 2020).
- 35% of off-premise customers are more likely to go for a restaurant that serves alcohol. This number grows to 53% for millennial diners (National Restaurant Association, 2021).
Source: Upserve 2020
Challenges in the Restaurant Industry Statistics
COVID-19 struck a devastating blow to the restaurant industry in 2020, which resulted in the closure of over 110,000 food establishments in the US. In 2021, the industry steadily recovered, but many concerns are still present. While the job outlook of food workers is promising, the industry’s unemployment rate remains high. Furthermore, the prices of many food commodities have gone up.
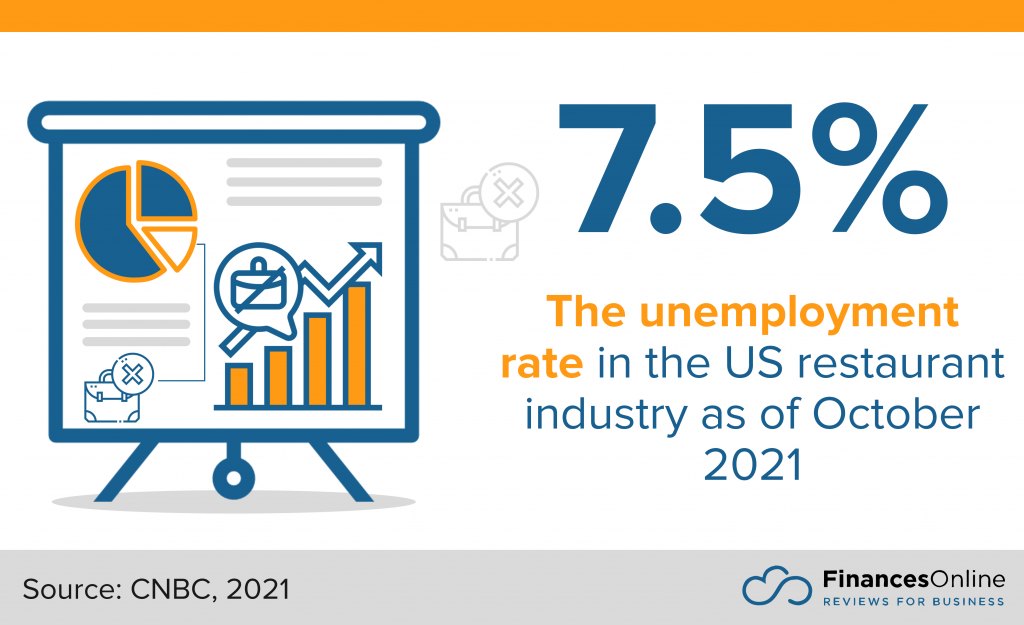
- As of October 2021, the restaurant industry’s unemployment rate in the US is 7.5% (CNBC, 2021).
- To add to that, 77% of US restaurant operators do not have sufficient staff to meet the current demand (AP News, 2021).
- From June 2020 to June 2021, the food commodities with the highest price increases are fat and oils (42.2%), beef (41.4%), pork (32.7%), processed poultry (27.4%), seafood (18.8%), eggs (16.3%), and flour (12.7%) (National Restaurant Association, 2021).
- In addition, menu prices have gone up by 3.9% and grocery prices by 2.2% in 2021 (National Restaurant Association, 2021).
- Guest concerns about health and safety are considered the most challenging change in consumer behavior since the pandemic with 56% of restaurants citing it as such, followed by preferences for healthy sourced foods (55%), the rising demand for convenience (28%), changing delivery preferences (28%), and interest in personalization (19%) (Panasonic, 2020).
- According to food businesses, COVID-19’s biggest impact is in health safety with a score of 4.8, followed by customer behavior (4,5), store operations and design (4), supply chain (4), and business model (3.7) (Panasonic, 2020).
Impact of the COVID-19 Delta and Omicron Variants
Just when the restaurant industry has shown signs of recovery in 2021, more transmissible versions of COVID-19 appeared: the Delta variant in August and the Omicron variant in December. Both variants have put a damper on the industry’s recovery. However, they won’t likely derail the industry progress given the presence of vaccines and the ongoing development of a cure for COVID.
- The number of on-premise diners on December 20, 2021, was 33% lower than that of the same day in 2019 due to the Omicron variant (OpenTable, 2022).
- Meanwhile, as of December 2021, the restaurant traffic in New York City dropped by 60% and in Washington D.C. by 53% compared to their 2019 figures due to the Omicron variant (Restaurant Dive, 2021).
- Moreover, due to Omicron, interest in catering services decreased by 22% on Yelp while inquiries and reviews of food delivery services went up by 13% in December 2021 (The Washington Post, 2021).
- In August 2021, 37% of US adults opted to have food delivered or ordered takeout instead of dining in a restaurant due to the delta variant, and 19% of those who dined out had their meals in the outdoor seating area (National Restaurant Association, 2021).
- As such, 19% of adults stopped going to food establishments due to the Delta variant (QSR, 2021).
- In August 2021, the number of full-service restaurants offering outdoor dining increased to 72% and limited-service restaurants to 57% due to the Delta variant (National Restaurant Association, 2021).
- Furthermore, the on-premise sales of a majority (40%) of restaurants only accounted for 1% to 20% of total sales after the onset of the Delta variant (National Restaurant Association, 2021).
- In the US, 41,500 jobs in bars and restaurants were lost in August 2021 due to the Delta variant (PYMNTS, 2021)
Restaurant Software Statistics
Besides offering or boosting delivery options, a lot of food establishments have embraced digitalization. The restaurant software statistics in 2022 show that food places are gunning for automation as well as adopting more tech. Innovations like online kiosks, digital menus, QR code platforms, and restaurant management solutions have surged in popularity since the start of the pandemic.
- 71% of food businesses believe that digital transformation is a crucial factor for business agility, higher than the share of rapid decision and learning cycles (50%), empowered teams (27%), and entrepreneurial culture (20%) (Panasonic, 2020).
- As such, 90% of restaurants think increased automation would help their staff concentrate more on important tasks (Square, 2021).
- In fact, about two out of three restaurant owners believe that automation would fill gaps in online order management (Square, 2021).
- 78% of restaurants say that the use of digital menus leads to significant benefits (Square, 2021).
- In addition, leveraging digital menu boards potentially leads to a yearly $16,000 increase in-store sales per unit (Presto, 2021).
- The number of QR code payment users is projected to increase from 1.5 billion in 2020 to over 2.2 billion by 2025, accounting for 29% of all mobile phone users globally (Juniper Research, 2021).
- In the US, the number of QR code payment users would likely increase by 240% from 2020 to 2025 (Juniper Research, 2021).
- One in two restaurants has adopted tech that promotes health and safety (Panasonic, 2020).
Source: Panasonic 2020
Best Restaurant Management Software
- Toast POS. This multi-function POS lets you process payments, oversee the kitchen, and make sure your restaurant always has plenty of ingredients in the pantry. Discover more of the software’s capabilities in our Toast POS review.
- TouchBistro. It may mainly be a POS system but it has robust functionalities that let you manage other aspects of your restaurant like menu planning. See what else this application has to offer in this TouchBistro review.
- Oracle Food and Beverage. More than just a POS, this application optimizes your kitchen processes. Our Oracle Food and Beverage review can show you what else it can do.
- Lavu. This smart mobile POS gives you full control over every facet of restaurant operation. But that is not all there is to it; you can find out more in this Lavu review.
- Form.com Restaurant Inspection. This solution utilizes forms and automation to help you ensure that your restaurant meets industry standards in cleanliness and others. Our Form.com Restaurant Inspection review discusses this comprehensively.
Online Marketing Statistics
It is in the best interest of restaurants to boost their online marketing plans, given that a large portion of their customer base is online. While friend and family recommendations are the leading sources of restaurant information, many of these dialogues take place on social media. The same goes for online reviews. Leveraging high-performing social media management software potentially increases their returns.
- 92% of restaurant owners plan to increase community engagement programs (Square, 2021).
- Meanwhile, the leading sources where diners discover restaurants are recommendations from friends and family (49%), online reviews (35%), restaurant websites (35%), Facebook (27%), restaurant social media (25%), food delivery apps (24%), online articles (19%), Instagram (18%), YouTube (15%), and newspapers (15%) (Toast, 2020).
- In addition, 29% of diners communicate with restaurants through their Facebook page while 18% do so on their Instagram profile (Toast, 2020).
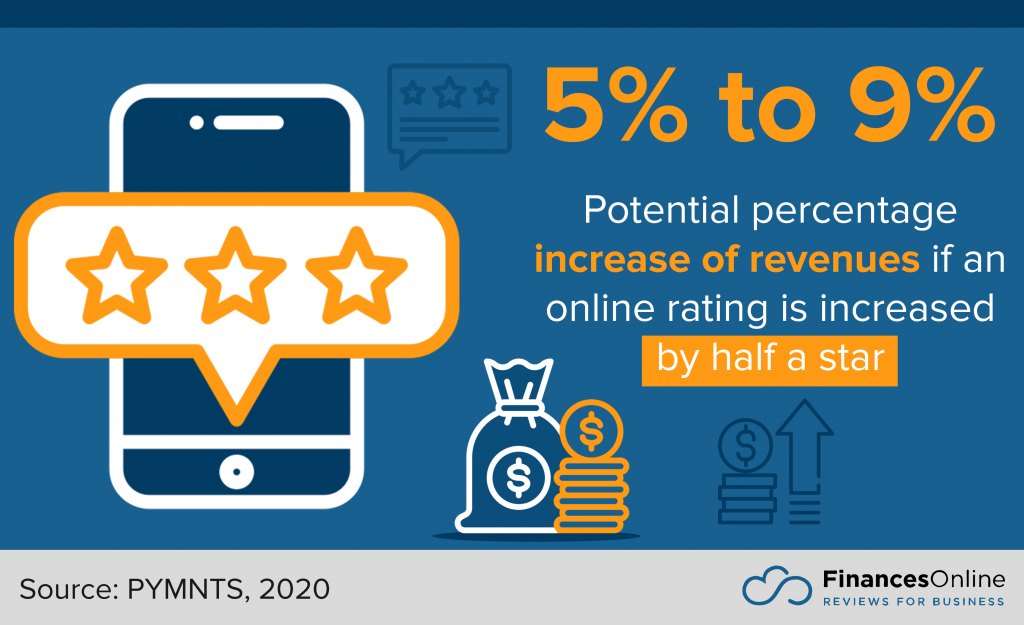
- Increasing a restaurant’s rating in online reviews by half a star can lead to a 5% to 9% increase in revenues (PYMNTS, 2020).
- Furthermore, 94% of consumers say that positive reviews make them more likely to use a business. Conversely, 92% of consumers say that negative reviews make them less likely to do so (BrightLocal, 2020).
- What’s more, only 13% of consumers do not read online reviews (BrightLocal, 2020).
- A majority (34%) of consumers use the internet daily to find local businesses and 25% do it multiple times a week (BrightLocal, 2020).
As the biggest social network, Facebook is the most used social media platform by restaurants in the US. With over 300 million American users on the platform, restaurants can expand the reach of their promotions in every area of interest. Users, in turn, flocked more to groups and business pages on the platform ever since the pandemic began.
- Facebook has the most North American restaurant profiles with 651,496, followed by Instagram (337,029), Twitter (266,216), and LinkedIn (32,939) (Brizo FoodMetrics, 2021).
- In 2020, the average number of posts per day across all industries and sectors on Facebook increased by 6.4% (Socialinsider, 2021).
- The restaurant-cafe category has the 5th highest amount of average engagements per post by followers on Facebook at 0.43%, higher than alcohol (0.39%), accommodation (0.35%), and travel (0.27%) (Socailinsider, 2021).
- Meanwhile, 18.3% of US adults have made a purchase on Facebook, higher than the rates of Instagram (11.1%) and Tiktok (1.4%) (eMarketer, 2021).
- In 2020, the searches for local businesses on Facebook increased by 23% as the memberships of local groups grew 3.3 times (Facebook, 2021).
Facebook may win the numbers game, but Instagram has the edge in terms of engagement, especially in food. In fact, the platform has shaped the food choices of consumers, one attractive food photo at a time. As such, investing in food styling and food photography for the platform is a good idea in this day and age.
- 90% of Instagram users follow a business profile on the platform (Instagram, 2020).
- 50% of users admit that they become interested in a brand upon seeing an ad on Instagram (Boston Hospitality Review, 2021).
- Interestingly, 30% of millennial diners stay away from restaurants with a weak Instagram presence (Social Media Today, 2020).
- Moreover, 69% of millennial diners take a photo of their food before eating (Social Media Today, 2020).
- Instagram has the highest average engagement rate per post for restaurants at 1.31%, higher than Facebook (0.40%) and Twitter (0.11%) (Socialinsider, 2021).
- In 2020, Instagram extended its lead in engagements further with a median rate of 1.40% per post, higher than Facebook (0.42%) and Twitter (0.09%) (Socialinsider, 2021).
Tiktok
Tiktok barges onto millions of smartphones and into the marketing plans of restaurateurs as the most downloaded app in 2021—and the results from leveraging the platform have been impressive. Seeing a food product on the platform can lead more than half of viewers to want to visit a restaurant. What’s more, the platform has led users to travel off-state just to visit an appealing restaurant they saw.
- 55% of TikTok users wanted to visit or order food from a food establishment after seeing “appetizing” food videos on the platform (MGH, 2021).
- Similarly, 51% of users visited a restaurant because they saw a new menu item on the platform (MGH, 2021).
- In addition, 36% of users order from food establishments after seeing them on the platform (Restaurant Dive, 2021).
- Moreover, more than 45% of users are willing to travel off-stage to visit a restaurant after seeing a well-made Tiktok video about it, and 16% already did (MGH, 2021).
- 35% of users also wanted to visit a restaurant because a TikTok video portrayed it as a place with a cool atmosphere (FastCasual.com, 2021).
- It’s interesting to note that 56.1% of TikTok’s ad audience is female while 43.9% is male (Datareportal, 2021).
Source: Brizo FoodMetrics 2021
How is automation shaping restaurant operations and efficiency?
Automation is becoming an integral part of modern restaurant operations, helping establishments streamline processes, reduce costs, and enhance customer experience. By automating repetitive tasks, restaurants can improve efficiency and allow staff to focus on more engaging aspects of the customer experience. Here’s how automation is transforming the industry:
- Order Management: Automated systems for online and in-person orders help eliminate errors, reduce wait times, and ensure accurate tracking of customer preferences. These systems also integrate with POS systems, keeping all order details centralized and accessible.
- Inventory and Stock Control: Automated inventory management software tracks stock levels in real-time, alerting managers when supplies are low and even triggering automatic reordering with suppliers. This reduces waste and minimizes the risk of running out of popular ingredients.
- Scheduling and Labor Management: Automated scheduling tools allow managers to optimize staff schedules based on peak times, minimizing labor costs while ensuring adequate staffing. These tools also provide employees with mobile access to schedules, reducing absenteeism and improving communication.
- Food Preparation and Cooking: Some restaurants now use automated cooking stations for preparing specific dishes or ingredients, reducing prep time and allowing chefs to focus on more complex tasks. Robotic food preparation is also gaining traction in high-demand areas like fast food.
- Customer Engagement and Marketing: Automation is enhancing customer loyalty programs, sending personalized promotions to diners based on their ordering history. Automated email and SMS marketing tools keep customers engaged with timely offers and updates.
- Contactless Payments and Self-Service: Self-service kiosks and QR code systems for ordering and payments streamline the dining experience, reducing wait times and enhancing convenience for customers while allowing staff to focus on service quality.
Dine Digital
The restaurant industry is at the crest of recovery as it inches closer to pre-pandemic numbers. As economies have reopened, people have gone back to dining out at their favorite establishments. With this, revenues have gone up significantly while new norms have been established to foster safety amid the pandemic. These norms point to a shift to digitalization, which conforms to current safety standards and the preferences of today’s diners.
Online food delivery remains a popular option, outpacing orders from in-store dining in the fast-food and casual dining industries. Restaurants should focus on building better delivery promos to attract the digital market, particularly the large chunk who use food delivery apps. It also makes perfect sense for food places to take online and social media marketing more seriously since these platforms have been proven to influence the food choices of users.
Despite the appearance of new COVID-19 variants, the outlook of the industry remains promising. After all, a lot of people have already been vaccinated and a cure is in the works. To know more about the future of the industry, you can check out the latest restaurant trends in the US and around the world.
Key Insights
- Restaurant Industry Recovery: The restaurant industry is rebounding from the COVID-19 pandemic, with significant growth in food and beverage sales from 2020 to 2021.
- Consumer Behavior Shift: There is a notable shift towards food delivery and takeout, with many consumers continuing to prefer these options even as dine-in services resume.
- Digital Transformation: Restaurants are increasingly adopting digital solutions like online ordering systems, digital menus, and QR code payments to enhance customer experiences and streamline operations.
- Sustainability Preferences: A significant number of consumers prioritize sustainable and recyclable packaging, reflecting a growing trend towards environmentally friendly practices in the industry.
- Staffing Challenges: Despite the industry’s recovery, many restaurants face staffing shortages, impacting their ability to meet demand.
- Health and Safety Concerns: Health and safety remain top priorities for consumers, influencing their dining choices and driving the adoption of contactless and outdoor dining options.
- Economic Impact: The restaurant industry’s economic impact is substantial, with significant contributions to the global and US economies. The sector is projected to continue growing, with increasing revenues from online food deliveries and innovative dining concepts like ghost kitchens.
FAQ
- How has the COVID-19 pandemic impacted the restaurant industry?
The COVID-19 pandemic led to widespread restaurant closures and significant financial losses. However, it also spurred innovation in the industry, with many establishments adopting new technologies and expanding their delivery and takeout services. - What are the current trends in the restaurant industry?
Current trends include a continued emphasis on food delivery and takeout, increased use of digital and contactless technologies, and a focus on sustainability and recyclable packaging. Outdoor dining and health and safety measures also remain prevalent. - How has consumer behavior changed in the restaurant industry post-pandemic?
Consumers have shown a strong preference for delivery and takeout options, as well as for contactless and digital ordering systems. There is also a growing demand for sustainable packaging and health and safety measures. - What role does technology play in the restaurant industry today?
Technology plays a crucial role in the modern restaurant industry, with many establishments using digital menus, online ordering systems, QR code payments, and restaurant management software to improve efficiency and enhance the customer experience. - What are the economic projections for the restaurant industry?
The global restaurant market is projected to grow at an annual rate of 5.4% through 2026. In the US, the industry is on track to reach pre-pandemic revenue levels, with significant growth expected in both food service sales and online food delivery revenues. - What are the challenges faced by the restaurant industry today?
Key challenges include staffing shortages, rising food commodity prices, and ongoing health and safety concerns due to new COVID-19 variants. However, the industry is adapting through digital transformation and innovative dining concepts. - How important is online and social media marketing for restaurants?
Online and social media marketing are essential for modern restaurants, as many consumers discover and engage with restaurants through these platforms. Positive online reviews and strong social media presence can significantly boost a restaurant’s visibility and customer base.
References:
- Ali, F. (2021, February 19). Charts: How the coronavirus is changing e-commerce. Digital Commerce 360
- Andrews, E. (2021, September 28). (SURVEY) How TikTok Influences Restaurant Dining Behavior. MGH
- Astound Commerce (2021). Shopping behavior and sentiments have rapidly evolved. Are you prepared to meet consumers’ needs this holiday season? Astound Commerce
- Berthiaume, D. (2021, May 12). Survey: Shoppers expect omnichannel services. CSA
- Black Box Intelligence (2021, December 14). Restaurant Industry Performance Pulse. Black Box Intelligence
- Brand Finance (2021, March). Restaurants 25 2021. Brand Finance
- Brizo FoodMetrics (2021). Restaurants and Social Media in 2021: Where Eateries Are Most Active. Brizo FoodMetrics
- Canham-Clyne, A. (2021, December 21). OpenTable data shows sharp dive in dine-in traffic as omicron spreads. Restaurant Dive
- Canham-Clyne, A. (2021, October 1). Survey: 36% of TikTok users order from restaurants after seeing them on the app. Restaurant Dive
- Devenyns, J. (2020, September 21). Coronavirus accelerates importance of packaging for consumers. Food Dive
- Durbin, D., Anderson, M., & Hui, S. (2021, December 19). Restaurants anxious as omicron, high food costs take toll. AP News
- eMarketer (2021, March 29). Click and collect, an already popular option, finds a new gear. eMarketer
- Enberg, J. (2021, January 12). Why Small Businesses Could Benefit from the Launch of Facebook Shops. eMarketer
- FastCasual.com (2021, October 1). TikToker influence growing in restaurant industry. FastCasual.com
- Global Industry Analysts (2021, October). Food Service Industry Global Market Trajectory & Analytics. Global Industry Analysts
- Gray, J. (2021, November 5). Curbside pickup is now a must-have for customers (and retailers). Retail Brew
- Hutchinson, A. (2020, February 20). How Instagram Changed the Restaurant Industry [Infographic]. Social Media Today
- International Food Information Council (2020, December). IFIC’s Year-End Survey: Consumer Insights from a Year Like No Other, and a Look to the Year Ahead. International Food Information Council
- Instagram (2020, October 6). Thank You and Happy Birthday, Instagram! Instagram
- Jiampetro, J. (2021, August 26). Have Restaurants Altered Their Social Media Approach? Boston Hospitality Review
- Jipa, A. (2021, January 19). [STUDY] 2021 Social Media Industry Benchmarks – Know Exactly Where You Stand in Your Market. Socialinsider
- Juniper Research (2021, January 11). QR CODE PAYMENT USERS TO REACH 2.2 BILLION GLOBALLY BY 2025, AS SERVICES EXPAND BEYOND CHINA & INDIA. Juniper Research
- Kats, R. (2020, August 19). More Consumers Are Turning to Food Delivery Apps amid Indoor Dining Restrictions. eMarketer
- Kemp, S. (2021, October 21). DIGITAL 2021 OCTOBER GLOBAL STATSHOT REPORT. Datareportal
- Klein, D. (2021, August 24). Delta Variant Has Already Changed Dining Behavior. QSR
- Littman, J. (2021, August 31). NRA boosts 2021 restaurant sales projection to $789B. Restaurant Dive
- Lucas, A. (2021, October 12). Restaurant wages tick higher but the industry’s labor crunch remains intractable. CNBC
- Murphy, R. (2020, December 9). Local Consumer Review Survey 2020. BrightLocal
- National Restaurant Association (2021). 2021 Top Restaurant Trends. National Restaurant Association
- National Restaurant Association (2021, October 6). Customer demand for outdoor dining rose due to the delta variant. National Restaurant Association
- National Restaurant Association (2021, August). Majority of Adults Changed Their Restaurant Usage as a Result of the Delta Variant. National Restaurant Association
- National Restaurant Association (2021). State of the Restaurant Industry 2021. National Restaurant Association
- National Restaurant Association (2021, August). State of the Restaurant Industry Mid-Year Update. National Restaurant Association
- OpenTable (2022). The restaurant industry in recovery. OpenTable
- Panasonic (2020, November). How the pandemic has transformed Food Services & Food Retail. Panasonic
- Paytronix (2021). Annual Order & Delivery Report: 2021. Paytronix
- Paytronix (2021). Order and Delivery Report: 2021. Paytronix
- Perri, J. (2021, December 20). Which company is winning the restaurant food delivery war? Bloomberg Second Measure
- Presto (2021, January 18). Speed Up the Wait With Digital Drive-Thru Menu Boards. Presto
- PYMNTS (2020, June 22). How Customer Reviews Provide Lifeblood For Restaurant Operations. PYMNTS
- PYMNTS (2021, September 12). In-Restaurant Dining Starts to Shut as Delta Variant Cases Increase. PYMNTS
- Resendes, S. (2020, November 12). Restaurant Menu Trends: How Covid Changed Restaurant Offerings in 2020. Upserve
- Siegel, R. & Reiley, L. (2021, December 17). Hot economy collides with huge virus surge in pandemic’s latest twist. The Washington Post
- Square (2021, December 8). The Future of Restaurant Report: 2022 Edition. Square
- Statista (2021, October). Online Food Delivery. Statista
- Toast (2020). Your Guide to the Restaurant Guest During COVID-19. Toast
- Trivium Packaging (2021). 2021 GLOBAL BUYING GREEN REPORT. Trivium Packaging
- U.S. Bureau of Labor Statistics (2021, September 8). Food and Beverage Serving and Related Workers. U.S. Bureau of Labor Statistics
- Valuates Reports (2021, May). Cloud Kitchen Market Size, Share & Global Trends Analysis Report By Type, By Product Type, By Nature, and Segment Forecasts, 2021-2027. Valuates Reports
- Valuates Reports (2021, July). Global Online Food Delivery Market Size, Status and Forecast 2021-2027. Valuates Reports


Leave a comment!