
Email marketing remains a tried and tested way to convince people to avail of products and services. While 84% of brands had to change their email marketing strategy in 2021 due to the COVID-19 pandemic (Litmus, 2021), the email marketing statistics that we will share in this post show that this channel remains one of the most reliable and most personal customer touchpoints.
Based on a 2021 customer survey, 80% of B2B customers and 75% of B2C customers expect consistent interactions with brands (Salesforce, 2021). Companies are addressing this through the personalization of email marketing.
From being a mere channel, email has evolved into a powerful marketing tool. Automation of processes through the use of email marketing software facilitated the collection of enormous amounts of customer data. The email marketing software statistics and industry information in this post show how data is being used to keep customers engaged, and, therefore, develop strong relationships with brands.

Email Marketing Software Statistics Table of Contents
State of Email Marketing Statistics
Time and again, email marketing demonstrates its importance in reaching customers on a deeper level. Through the years, this marketing tool has gathered crucial customer data that has continually driven marketing strategies.
Email marketing played a crucial role in keeping customers engaged during the lockdowns and made possible a sustained conversation on a personal level. With personalization as the current focus this 2022, organizations, with the help of email marketing software companies, are poised to explore the next stages of customer engagement. These statistics show that email marketing will continue to take the path towards high growth.
- Email marketing market size is valued at $20.62 billion by 2028 and is expected to grow at a compound annual growth rate of 15.2% (Data Bridge, 2021).
- The transactional and marketing emails market is poised to grow by $8.87 billion from 2021 to 2025 (Business Wire, 2021).
- The email marketing software market is expected to grow from $1.24 billion in 2021 to $2.53 billion in 2028 at a CAGR of 10.7% (Fortune Business Insights, 2022).
- The global email marketing market was valued at $4.51 billion in 2016 and is expected to be valued at $22.16 billion by the end of 2025 (Newswires, 2022).
- 57% of US retailers increased spending on email marketing in 2020 (Kantar and Catalyst, 2021).
- As of May 2021, chief marketing officers (CMOs) worldwide have allocated 9.7% of their marketing budgets to email marketing (Forbes, 2021).
- 77% of marketers reported seeing more engagement with email in 2021 (HubSpot, 2021).
- Traffic from email campaigns has an average conversion rate of 4.29% which is higher than the average traffic from search, direct, and social media (Wordstream, 2021).
- Compared to pre-pandemic workload, marketers agree that email volume increased by 61%, last-minute email changes increased by 45%, and educational email content increased by 43% (Litmus, 2021).
- 42% of brands do not plan to mention their stance on diversity, equity, and inclusion (DE&I), although 64% have made conscious DE&I efforts through demographics as represented in imagery (SmartHQ, 2021).
- $36 was the average email marketing return on investment (ROI) across all industries in 2020. The ROI varies depending on the nature of the industry—Retail, ecommerce, and consumer goods industry yielded $45; Marketing, PR, advertising agency yielded $42; Software and technology industry yielded $36; and Media, publishing, events, sports, and entertainment yielded $32 (Litmus, 2020).
Source: Global Industry Analysts, Report Linker
B2B Email Marketing
Marketers in this sector are working towards a new level of personalization, also referred to as account-based marketing (ABM). Here, we present B2B email marketing statistics that businesses may use as benchmarks on how brands are interacting with other brands through email marketing.
- 72% of marketers agreed that communicating with prospects is a top priority (Validity, 2021).
- 42% of organizations said their marketing efforts were not fully personalized (Business Wire, 2020).
- 93% of firms used email marketing (Hubspot, 2021).
- 55% of marketers agreed that marketing personalization leads to higher rates of sales conversions and future growth (Business Wire, 2020).
- 75% of organizations use email marketing software (Content Marketing Institute, 2021).
- 60% of brands were not using AI or machine learning to personalize their marketing efforts (Business Wire, 2020).
- 83% of companies use email newsletters (Hubspot, 2021).
- 64% of content marketers agreed that email engagement is one of the top three measures that provide the most insight into B2B content performance (Content Marketing Institute, 2021).
- 21% of marketers are not using data on existing customers to personalize content (Business Wire, 2020).
- 40% of marketers considered email newsletters as most critical in content marketing success (Hubspot, 2021).
- 77% of sales and marketing professionals believe personalized marketing experiences make for better customer relationships (Business Wire, 2020).
B2C Email Marketing
By 2022, 55% of marketers are making personalization a priority in the B2C landscape (Litmus, 2021). The following statistics on email personalization enumerate the benefits of customizing content.
- 9 in 10 marketers believe that personalization is imperative to overall business strategy (Litmus, 2021).
- The percentage of B2C marketers who report “revenue generation” as a key objective fell by 35% in 2020 (Validity, 2021).
- 80% of customers are more likely to purchase from a brand that provides personalized experiences (Litmus, 2021).
- 75% of B2C marketers considered communication with customers as the most crucial (Validity, 2021).
- 83% of customers were willing to share their data to create a more personalized experience (Litmus, 2021).
- 60% of consumers made a purchase as a result of email marketing (Constant Contact, 2022).
- 76% of buyers expect more personalized attention from marketers (Litmus, 2021).
- 44% of adults in the United Kingdom consider the sustainability of materials and processes companies use to have a significant impact on their use of products (Forrester Research, 2021).
- 54.3% of teenagers and 52.4% of young adults (18-24) used email specifically for online purchases (LeadPost, 2021).

Mobile Email Marketing
As more consumers use smartphones to access the web, mobile email marketing is growing at a pace that marketers need to catch up. Marketing emails need to be mobile optimized to capture this growing market.
- In 2022 it is projected that 1 in 3.2 adults will search for a clothing product on their smartphone (Forrester Research, 2021).
- Mobile devices accounted for 41.9% of all opened emails (Litmus, 2021).
- 68% of email campaigns were being opened on mobile devices (Campaign Monitor, 2019).
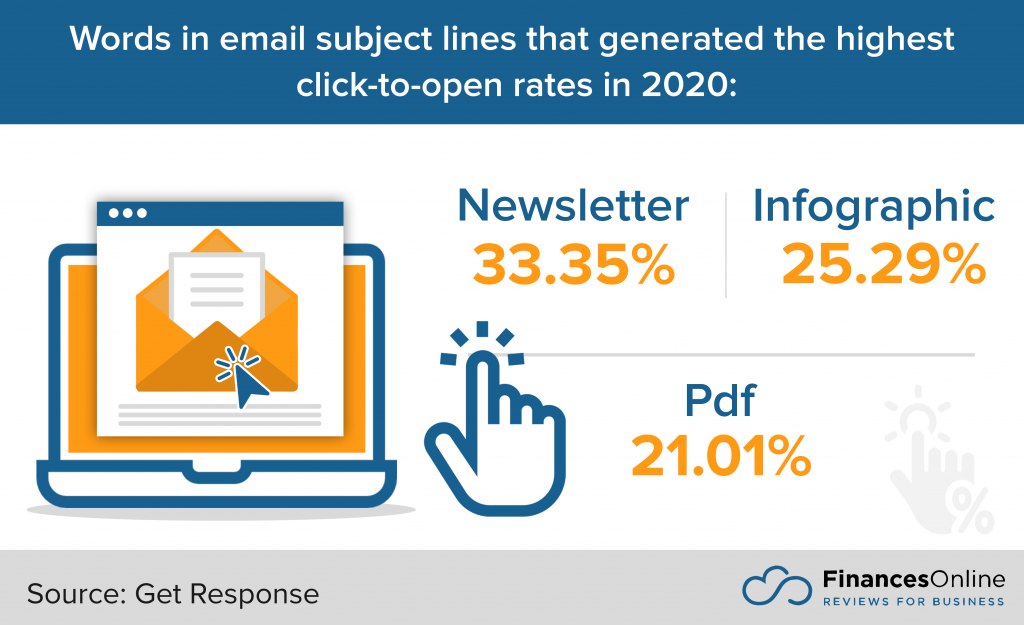
- 45.10% of all message clicks were on mobile (Get Response, 2020).
- Over 80% of email users accessed their inbox on their phones, and emails that are not optimized for mobile are deleted in 3 seconds (Hubspot, 2021).
- One out of every three clicks in an email was registered on a mobile device (Campaign Monitor, 2021).
- For Thanksgiving and Black Friday shopping in 2020, smartphones accounted for nearly 60% of all orders (Klaviyo, 2020).
- For Cyber Monday 2020, smartphones accounted for 50.8% of purchases (Klaviyo, 2020).
Email User Behavior Statistics
Budget officers often ask what is the success rate of email marketing, a query to which no single metric can provide the answer. This is because the success rate is influenced by several factors—open rates, click-through rates, and conversions, to name a few.
The most important determinant of success, however, is the attitude of the customer towards the marketing email.
Customer preferences constantly shift. Influenced by a confluence of external and internal factors, the ever-changing behavior of the customer is what keeps marketers alert of subtle changes in customer data. The following data show what marketers currently know about customer behavior.
- 24.45% of emails were opened on mobile, 75.55% on desktop and webmail (Get Response, 2020).
- Eight out of 10 people open welcome emails—welcome emails get an average open rate of 86.03% and a click-to-open rate of 28.7% (Get Response, 2020).
- Image-based emails have a 21.44% open rate while text-based emails have a 15.02% open rate (Get Response, 2020).
- Automated webinar reminder emails sent one hour before the webinar had the highest open rate at 138.41%, highest click-through rate at 64.41%, and highest CTOR at 46.54% (Get Response, 2020).
- Marketers with a 1,000 to 2,499 list size get the highest open rate at 32.11% while those with a list size of more than 100,000 get a 15.97% open rate (Get Response, 2020).
- In 2020, landing pages that promoted a webinar had the highest conversion rate at 8.71% (Get Response, 2020).
In email marketing, sending newsletters is one of the top strategies to keep customers connected to the brand. Customers, however, differ in their sentiments when it comes to email newsletters.
- 12.8 of email users find email newsletter ads as very influential in their shopping decisions (What If Media Group, 2021).
- An emoji in the subject line of an email increases the open rate by 29% and the click-through-rate by 28% (Campaign Monitor, 2019)
- Only 13.1% of email users found email newsletters ads to be very relevant (What If Media Group, 2021).
- 32.4% of email users fond email newsletter ads as somewhat relevant, with 26% not noticing any ads on the newsletter (What If Media Group, 2021).
The responses of customers towards newsletters also differ. The following data reveal that customers prefer not to get an inbox full of newsletters.
- 47.5% of marketers send one email newsletter per week, of which they get an average 30.09% open rate, 3.63% click-through rate, 12.06% click-to-open rate, 0.23% unsubscribe rate, and 0.02% complaint rate (Get Response, 2020).
- 3.93% of marketers send five email newsletters per week, of which they get an average 19.47% open rate, 2.02% click-through rate, 10.36% click-to-open rate, 0.11% unsubscribe rate, and 0.01% complaint rate (Get Response, 2020).
Source: Cisco Talos Intelligence Group
Email Marketing Metrics
Email marketing metrics have consistently assisted marketers in gathering customer insights. However, this is set to change in 2022 as the industry adjusts with the implementation of mail privacy protection (MPP). As customer data privacy takes center stage, marketers need to find new ways to keep a tab on how the customer interacts with marketing emails.
As marketers navigate through these latest developments, the following metrics still serve as a guide for optimizing email marketing.
- 18% is the average global marketing email open rate in 2020 (Campaign Monitor, 2020).
- 14.1% is the average email marketing click-to-open rate worldwide in 2020 (Campaign Monitor, 2020).
- 2.6% is the average marketing email click-through-rate worldwide in 2020 (Campaign Monitor, 2020).
- The nonprofit industry had the highest open rate at 30.85% while internet marketing had the lowest at 14.97% (Get Response, 2020).
- The publishing industry had the highest average click-through rate at 4.29%, while travel had the lowest at 1.61% (Get Response, 2020).
- The real estate industry had the highest spam rate at 0.06%, followed by automotive at 0.02% (Get Response, 2020).
- The automotive industry had the highest unsubscribe rate at 0.26%, while the communication industry had the lowest at 0.05% (Get Response, 2020).
- The best days to send marketing emails vary. The following reference points reveal that email users have more time on Fridays and less time on weekends when it comes to checking marketing email.
- The best day to send marketing email is Friday with email open rates at 18.9% and click-through rate at 2.7%.
- The best day with the highest click-to-open rate is Tuesday and Friday at 14.5%.
- The best days with the lowest unsubscribe rate is Saturday and Sunday at 0.1%.
- Saturday had the lowest email open rate at 17.3%, and also had the lowest click-through rate at 2.4%.
- Tuesday had the lowest click-to-open rate at 13.5% (Campaign Monitor, 2021).
- Around 22% of all email campaigns are opened in the very first hour after sending, and 26% of subscribers will open emails seven to 24 hours after receiving them (Get Response, 2020).
- Based on the following data, the best time to send an email is between 3 to 4 in the morning.
- 22% of all email campaigns are opened in the very first hour after sending.
- Emails sent at 4 AM had the highest conversion rate at 24.31%.
- Emails sent at 3 AM and 11 PM had the highest click-to-open rate at 19.12%.
- Emails sent at 3 AM had the highest click-through rate at 3.47% (Get Response, 2020).
- In terms of averages per region, Australia had the highest open rate at 20.6%, the UK had the lowest at 16.4 (Campaign Monitor, 2021)
- For click-through rate per region, Australia had the highest click-through rate at 3.10% while the UK had the lowest at 1.6% (Campaign Monitor, 2021).
- For click-to-open rate, Australia had the highest at 14.8%, the UK at 9.9% (Campaign Monitor, 2021).
- For unsubscribe rate, Australia had the highest at 0.20% with the rest of the regions at 0.10% (Campaign Monitor, 2021).
Data on Email Marketing Strategies
Marketers perform various types of testing to identify which strategy works best with specific customer segments. Depending on the data gathered, tactics are repeatedly revised or fine-tuned to be able to pinpoint the actions that deliver results.
- The top email marketing objectives in 2020 include capturing data on subscribers at 29%, generating revenue at 52%, communicating with prospects at 64%, communicating with customers at 71%, and building brand awareness at 69% (Validity, 2021).
- To achieve these objectives, marketers adopt strategies such as email list management (56%), subject line optimization (47%), A/B testing (43%), email delivery optimization (36%), and reactivation campaigns (30%) (Validity, 2021).
- Emails with a single call to action (CTA) increased clicks by 371% and sales by 1617% (Wordstream, 2021).
- Only 13% of marketers use AI (Validity, 2021).
- In 2020, 68% of firms used their email to interact with clients while 79% used their websites (Hubspot, 2021).
- 16.3% of marketers from financial services, 16.24% from publishing, and 15.13% from education use double opt-in (Get Response, 2020).
- Only 12% of marketers use multivariate testing (Validity, 2021).
- 62% of marketers change the tone of an email in reaction to what is happening around the world (Litmus, 2020).
- 24% of marketers subscribe to competitor emails using their true identity while 43% do not monitor competitors’ efforts (Validity, 2021).
- 76% of marketers are using frameworks or templates and 58% are using email guidelines or design systems to find more agile systems (Litmus, 2020).
- Email automation delivers high open and click-through rates with triggered emails registering 38.03% open rate and 6.76% click-through rate; followed by autoresponder at 26.7% open rate and 3.6% click-through rate (Get Response, 2020).
- Among big spenders, email newsletters are correlated with the highest average monthly spend with 39.4% of those spending $500 or more signed up for them (What If Media Group, 2021 ).
- More than 65% of marketers are creating at least two versions of an email, while nearly 16% are creating four or more (Litmus, 2020)
- Emails that feature a Vimeo video or link had a 38.89% open rate in 2020, while emails with a YouTube video or link had a 24.68% open rate (Get Response, 2020).
- 39% of marketers using segmented email lists experienced higher open rates, 24% greater revenue, and a 28% reduction in unsubscribe rates (Engine Mailer, 2021).
- Marketers who have an inbox placement rate (IPR) of 90% or more employ higher rates of email personalization (+12%), email list management (+10%), multivariate testing (+8%), reactivation campaigns (+4%), and A/B testing (+25%) (Validity, 2021).
- Marketers with more than 90% inbox placement rates (IPR) typically employ a variety of list management tactics (Validity, 2021).
- In line with the previous data point, some of these tactics are the honoring of opt-out requests (93%), removing bounced email addresses (64%), adding new email addresses to the list organically, via inbound marketing (71%), and removing lapsed recipients by lack of engagement or spam complaints (Validity, 2021).
- In addition, these high-performing marketers with high IPR rates see to it that everything is covered when it comes to subscriber preferences. Marketers who report greater than 90% IPR always monitor crucial metrics (Validity, 2021).
- Among the crucial metrics were what time subscribers are opening emails (75%), which mobile devices subscribers are they using (78%), when emails are being opened (68%), which browsers are being used (64%), which email clients are used (68%), and how much time is spent on reading emails (46%) (Validity, 2021).
Source: Litmus
Personalization
With 69% of marketers employing personalization in email marketing, more practitioners are keen on adopting this practice to improve engagement (Validity, 2021).
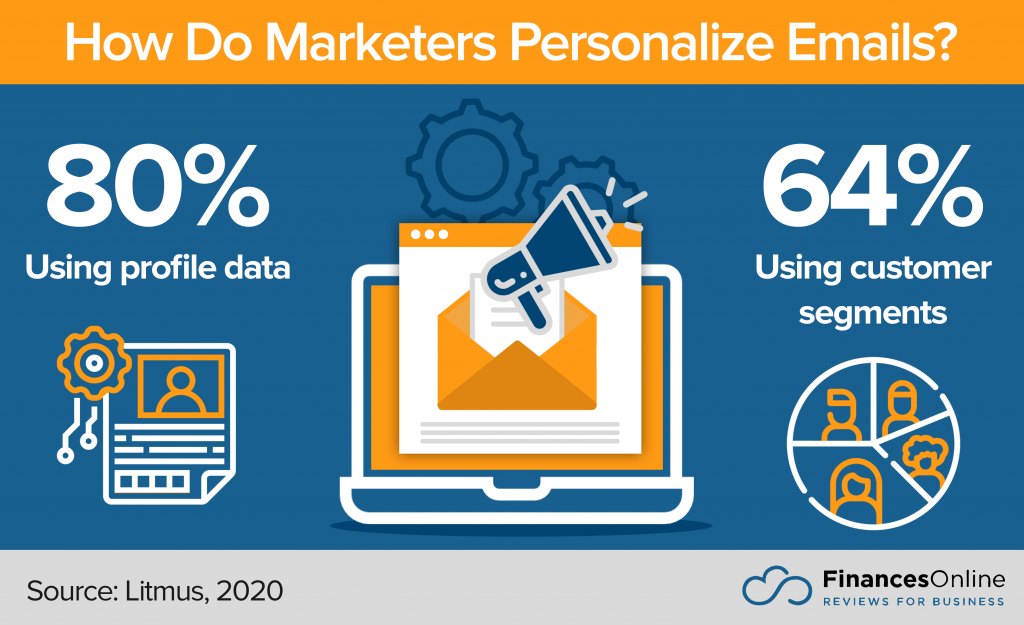
- 80% of marketers personalize emails with profile data, and 64% personalize by customer segment (Litmus, 2020).
- 35% of marketers are prioritizing personalization to enrich customer data (Litmus, 2020).
- The difference between personalized and non-personalized subject lines is only about one percentage point (Get Response, 2020).
- 83.25% of messages in 2019-2020 did not employ personalization in the email subject line had a 19.57% open rate while emails that used personalization had a 20.66% open rate (Get Response, 2020).
- Only 31.93% of marketers employ personalization in the email body (Get Response, 2020).
The Subject Line
The email subject line is one important aspect of email marketing that influences engagement. Marketers have identified specific strategies that increase open rates.
- Email subject lines with an emoji increased open rates by 56%, as compared to text-only subject lines (Campaign Monitor, 2019).
- Subject lines that are 14 to 24 characters long (approximately 3-5 words) are most likely to boost your open email rates (Campaign Monitor, 2019).
- Emails with preheaders and subject lines can boost open rates by 7% (Campaign Monitor, 2019).
- Only 14% of marketers used a preheader in sending emails—emails with a preheader got higher than average open rates at 22.28% vs. 19.33% (Get Response, 2020)
- The best performing email subject lines were the ones that have between 241 and 250 characters with a 32.85% open rate (Get Response, 2020).
Email Newsletters
Part of the marketer’s strategy is sending discounts to customers through email newsletters. The following statistics show how discounts in marketing emails encourage spending.
- Based on monthly grocery spending, the discount method availed by most customers come from email newsletters with customers that spend more than $500 availing 39.4% of discounts. Those who spend less than $100 avail 36.2%, those who spend between $100 and $259 avail 34.3%, those who spend between $250 and $500 avail 37.6%, and those who spend over $500 avail 39.4% (What If Media Group, 2021).
- 41.6% of consumers use the discount offers sent through email newsletters for monthly health and wellness expenditures (What If Media Group, 2021)
Data Privacy
Privacy is important to customers. Part of building relationships is building trust, and customers are very particular about the steps that brands are taking to keep their personal information secure. Email authentication is one strategy that marketers employ to show their intention to gain the customer’s trust.
- Brand Indicators for Message Identification (BIMI) had increased open rates by 21%, average purchase likelihood by 34%, increase brand recall by 18% and increase confidence in email by 90% (Litmus, 2021).
- Only 15% of marketers have implemented BIMI as of 2021, while 21% plan to use BIMI in 2022 (Litmus, 2021).
- Only 21% of marketers reported using BMI (Validity, 2021).
- Only 26% of marketers have a domain message authentication reporting and conformance (DMARC) policy in place (Validity, 2021).
Statistics on Email Marketing Software
As email marketing software continues to automate processes, marketers continue to look for ways to reach the optimal mix of strategies that will deliver high levels of engagement. The following email marketing software statistics show the benefits of email marketing software and how email marketers are leveraging the technology to keep customers connected.
- 43% of marketers used software or technology to validate email addresses (Validity, 2021).
- 25% of marketers used technology to ensure that invalid emails have been removed (Validity, 2021).
- 66% of marketers used software to preview email campaigns across all devices before sending (Validity, 2021).
- 67% of US marketers use email marketing solutions and A/B testing as main tools in executing personalization (Everengage).
- 55% of marketers rarely or never used A/B testing (Litmus, 2021)
- The top 3 most automated emails were welcome emails at 83%, onboarding or post-purchase at 68%, and subscriber re-engagement at 40% (Litmus, 2021).
- 59% of marketers intended to expand automation for their email programs (Litmus, 2021).
- 47% of marketers are using technology to get a comprehensive look at open rates (Validity, 2021)
- 52% of marketers with 16 or more average open rates monitor their sender reputation (Validity, 2021)
- 42% of marketers use technology to continuously check to make sure IP addresses have not appeared on any blocklists (Validity, 2021)
- 79% of marketers use automation in email marketing (Litmus, 2021)
- Among the uses of automation were triggered emails (82%), drip or nurture campaigns (67%), segmentation (56%), A/B testing (45%), reporting (32%), email content (27%), list verification and hygiene (25%), contact management (19%), email development 12%, and QA testing 7% (Litmus, 2021).
- Only 14% of marketers used AI in email marketing (Litmus, 2021).
- Of the marketers that use AI, 70% used it for send time optimization/personalization and 55% used it for segmentation and subscriber targeting. Meanwhile, 47% used AI for individualized product recommendations and content suggestions, and 32% used it for writing or suggesting personalized subject lines, call-to-action, or other copies (Litmus, 2021).
Source: The Latka Agency
Most Popular Email Marketing Software
- HubSpot Marketing. A sophisticated email marketing system that integrates all marketing efforts in a single location. Learn how it can help your marketing teams boost productivity in this HubSpot Marketing review.
- SendinBlue Email. This email marketing tool helps businesses optimize email campaigns to their advantage. This SendinBlue Email review will inform you how it works.
- Marketo. Enables businesses to streamline their marketing processes for better efficiency and higher revenues. For more details, read our Marketo review.
- ActiveCampaign. An easy-to-use email marketing software that automates the marketing activities of more than 100,000 businesses across the world. Know more about it in this ActiveCampaign review.
- ActiveTrail. An all-in-one email and SMS marketing automation solution. Discover how its innovative tools make marketing easy and manageable in our ActiveTrail review.
Email Marketing During COVID-19 Statistics
An increase in email marketing engagement is one notable behavior at the onset of the pandemic. As more people shelter in place, they had more time to check emails and engage with brands. The following trends in email marketing were noted.
- Email sends were up 19% from February 2020 to March 2020 (Campaign Monitor, 2020).
- Promotional email content decreased by 12% and email engagement decreased by 9% since the onset of the pandemic (Litmus, 2021).
- 16% increase in opens was noted from February to March 2020 (Campaign Monitor, 2020).
- Unsubscribe rates decreased 38% year over year for government senders, showing subscribers’ need to keep track of news in this industry (Campaign Monitor, 2020).
- Average email benchmarks for all industries in March 2020 included average open rate (21.7%), average click-through rate (2.78%), average click-to-open rate (12.8%), average unsubscribe rate (0.13%), and average bounce rate (0.71%) (Campaign Monitor, 2020).
- During the pandemic, the highest open rates of emails occur on Fridays (22.2%) and Mondays (22%).
- In addition, the highest click-through rates were often yielded every Wednesday (3.01%), Monday (3%), and Friday (2.97%) (Campaign Monitor, 2020)
- Marketers often get the highest click-to-open rates every Sunday (14.7%), Saturday (14.1%), and Wednesday (13.8%) in 2020 (Campaign Monitor, 2020)
- Since the COVID-19 outbreak, the lowest unsubscribe rates happened every Sunday (0.1%), Saturday (0.11%), and Monday (0.13%) (Campaign Monitor, 2020)
- The lowest bounce rates occur on Sundays (0.38%) and Mondays (0.72%) (Campaign Monitor, 2020).

Email Marketing Challenges Statistics
Despite the proliferation of email marketing tools that automate the management of customer data, marketers still face challenges. After all, customers are humans, and humans have nuances that machines cannot capture. Here, we present what marketers need to continually wrestle with when it comes to the email marketing process.
- 42% of marketers agree that competition for attention is a top email marketing challenge (Validity, 2021).
- The number of marketers spending two weeks or more on a single email had increased from 53% in 2020 to 58% in 2021 (Litmus, 2021).
- Only 19% of marketers reported an inbox placement rate of at least 90%, the rest reported 67% to 89%, or less (Validity, 2021).
- 63% of marketers are more worried about Apple’s mail privacy protection (MPP) than losing third-party cookies (Litmus, 2021).
- 35% of marketers think that poor email engagement is a major concern (Validity, 2021).
- 43% of marketers are changing how they measure email performance due to MPP (Litmus, 2021).
- 33% of marketers struggle with staffing and resource constraints (Validity, 2021).
- 43% of marketers agreed that MPP has changed how emails are measured (Litmus, 2021).
- 30% of marketers agreed that email deliverability is a constant challenge (Validity, 2021).
- 25% of marketers cite low visibility into email performance as a drawback (Validity, 2021).
- When optimizing an email marketing strategy, marketers say their top challenges include maintaining an engaged list (45%), reducing spam complaints (37%), increasing email list size (34%), achieving measurable ROI (33%), integrating data with other systems (29%), leveraging personalization effectively (28%), and optimizing for mobile (22%) (Marketing Charts, 2021).
Source: Litmus
Email Marketing Will Continue To Enhance Customer Experience
As reflected by these email marketing software statistics 2022, marketers are continually optimizing processes to achieve higher engagement levels. Access to customer data may have been hampered by new privacy policies, but marketers will continue to look for ways to gain the trust of customers.
The advancements in email marketing software provide an assurance that optimal customer experience will always be at the core of designing new technologies. The sophistication of email marketing solutions will continue to grow, and organizations and customers stand to benefit from enhanced conversations and relationships.
References:
- Adams, K. (2021 November 11) 4 Tips B2B Email Marketers Should Take from B2C Brands. Validity
- Businesswire (2021 August 12). Global Transactional and Marketing Emails Market (2021 to 2025) – Featuring Constant Contact, Message Systems and Oracle Among Others – ResearchAndMarkets.com. Businesswire
- Business Wire (2020 March 11) Folloze Research Indicates That Most B2B Marketing and Sales Teams Link Personalization Efforts to Fueling Long Term Growth. Business Wire
- Campaign Monitor (2020) Email Marketing Benchmarks: COVID-19 Edition. Campaign Monitor
- Campaign Monitor (2019 April 24) The Real Scoop on Email Emoji in Subject Lines. Campaign Monitor
- Campaign Monitor (2019 July 11) The Key to Email Subject Lines That Get Opened: 8 Data-Backed Ways To Boost Open Rates.Campaign Monitor
- Campaign Monitor (2021). Ultimate Email Marketing Benchmarks for 2021: By Industry and Day. Campaign Monitor
- Constant Contact (2022 January 4) 10 Email Marketing Statistics You Need to Know. Constant Contact
- Content Marketing Institute (2021) B2B Content Marketing. Content Marketing Institute
- Chaffey, D. (2021 March 18). How do you compare? 2021 average email open rates, clickthrough rates, and marketing statistics compilation. Smart Insights
- Data Bridge Market Research (2021 February) Global Email Marketing Market – Industry Trends and Forecast to 2028. Data Bridge Market Research
- Dean, B. (2021 September 1) 67 Key Email Marketing Stats For 2021. Backlinko
- Decker. A. (2021). Hubspot The Ultimate Guide to B2B Marketing in 2022. Hubspot
- Engine Mailer (2021 July 26) B2C Email Marketing: Best Practices And Strategies To Increase Your Click-Throughs. Engine Mailer
- Fortune Business Insights (2022 January) Email Marketing Software Market Size, share, and COVID-19 Impact Analysis. Fortune Business Insights
- Get Response (2020). Email Marketing Benchmarks 2020. Get Response
- Kantar and Catalyst (2021) The State of Ecommerce 2021. Kantar and Catalyst
- LeadPost (2021) How to Increase Sales With B2C Email Retargeting. LeadPost
- Lesonsky, R. (2020 October 26) Email Marketing: Still The Most Powerful Tool To Take Your Business To The Next Level. Forbes
- Litmus (2020). Email client market share in 2020: What’s most popular? [Infographic]. Litmus
- Marketing Charts (2021 September 1). 8 in 10 Marketers Say Their Customer Engagement is Data-Driven Marketing Charts
- Mclaughlin, M. and Sevilla, G. (2021 December 10) The Best Email Marketing Software for 2022. PC Mag
- Newswires (2022 January 4) Email Marketing Industry to Expand at a Stellar Pace 22.80% CAGR in Asia Pacific. Newswires
- Salesforce (2021). State of the connected consumer 4th Edition. Salesforce
- Skinner, R. and Husson, T. (2021 October 26) Europe Predictions 2022: B2C Marketing. Forrester Research
- SmarterHQ (2021) Marketers Are on a Mission: The State of B2C Marketing Report. SmarterHQ
- Swant, M. (2021 July 18) Marketing Budgets Continue To Get Slashed, Even As Companies Look To CMOs For Growth. Forbes
- Tierney, K. (2020 December 1) How 50,000+ Ecommerce Brands Used Owned Marketing to Drive Nearly $1 Billion in Online Store Sales Across Cyber Weekend 2020. Klaviyo
- Talos Intelligence (2022) IP and Domain Reputation Center. Talos Intelligence
- What If Media Group (2021) The Pandemic Shopper. What If Media Group
- What If Media Group (2021 February 6) The State of Email Newsletter: 2021 and Beyond. What If Media Group
- Validity (2021) The State of Email Marketing. Validity
- Whitney, M. (2021 November 22) 6 Mind-Blowing Digital Marketing Stats from Unbounce’s Conversion Road Trip. Wordstream


Leave a comment!