
Content marketing is all about creating, repurposing, and promoting both visual & written content to engage, educate and provide value to your audience. The goal is to build an authentic relationship with your audience with the intention of converting them into paying customers.
One of the most engaging content types is infographics which help you convey complex information in an easily digestible way. That’s one of the major reasons why tech and marketing giants like Hubspot, Ahref, Neil Patel, or Search Engine Journey, love infographics.
Let’s look into some of the interesting statistics on why infographics are the go-to content marketing strategy.
- Infographics improve readership by 80%.
- 67% of B2B marketers invest in creating engaging infographics.
- People are expected to skim through graphics 30X more than reading the whole article.
- The engagement rate of posts with images is 650% more than text.
- The total search volume of the word infographics is, 71,000
In this article, we will focus on how to use infographics as part of your content marketing strategy.

What is an infographic in content marketing?
An infographic is a visual representation of information or data in a graphical format that is designed to communicate complex information quickly and clearly. It uses a combination of images, charts, and text to present information in a concise, easy-to-understand format.
In content marketing, infographics are used to educate, engage, and inform audiences about a particular topic or product. This makes infographics an effective tool for creating brand awareness, generating leads, and increasing conversions.
Let’s first look into the reasons why infographics are essential for your marketing strategy in 2023.
Reasons why Infographics are Essential to your Content Marketing Strategy
Infographics can be a valuable addition to your content marketing strategy for several reasons:
They are visually appealing
Infographics use a combination of images, charts, and text to present information in a clear and engaging way. They can help to grab the attention of your target audience and make your content stand out.
They are easy to digest
Infographics are designed to simplify complex information and make it easier for people to understand. They break down information into manageable chunks and present it in a way that is easy to comprehend.
They’re great for SEO
Infographics can attract and retain more visitors to a website, thus increasing the dwell time and reducing the bounce rate, which are crucial ranking factors for SEO. Also, by including keywords and high-quality backlinks in the infographic, can help drive traffic to the website and increase its visibility in search engine results pages (SERPs).
They are easily shareable
Infographics are highly shareable on social media and other online platforms. They are a great way to get your message across to a wider audience and increase brand awareness.
They are versatile
Infographics can be used to communicate a wide range of information, from statistics and data to step-by-step instructions. They can also be used across different marketing channels, from blogs and websites to presentations and email marketing.
How to Use Infographics to Strengthen Your Content Marketing Strategy
Infographics are a powerful tool for enhancing content marketing efforts by making information more understandable, accessible and appealing. Generally, infographics help in the following ways,
- Infographics help you explain concepts easily.
- You can turn boring content into shareable graphics, that are easily digestible.
- They help your brand to grow and strengthen its recognition.
- Infographics seamlessly improve search engine optimization.
- It improves engagement rates.
- Infographics improve readership by 80%.
- It’s easy to repurpose old content and turn them into infographics.
Now let’s discuss how you can use infographics to strengthen your content marketing strategy:
1. Help Improve your Blog Posts
Incorporating infographics into your blog posts can break up large blocks of text and make the information more visually appealing. It is a great way to illustrate key points and make your blog posts more engaging and memorable for readers.
Using infographics also makes a post more shareable, as they are often more eye-catching and memorable than text alone. Additionally, infographics help to increase the credibility of a post, as they can provide evidence and support for claims made in the text.
Here’s an example of a Visme blog that shows how to add mini infographics between the text to make your blog content engaging to read.
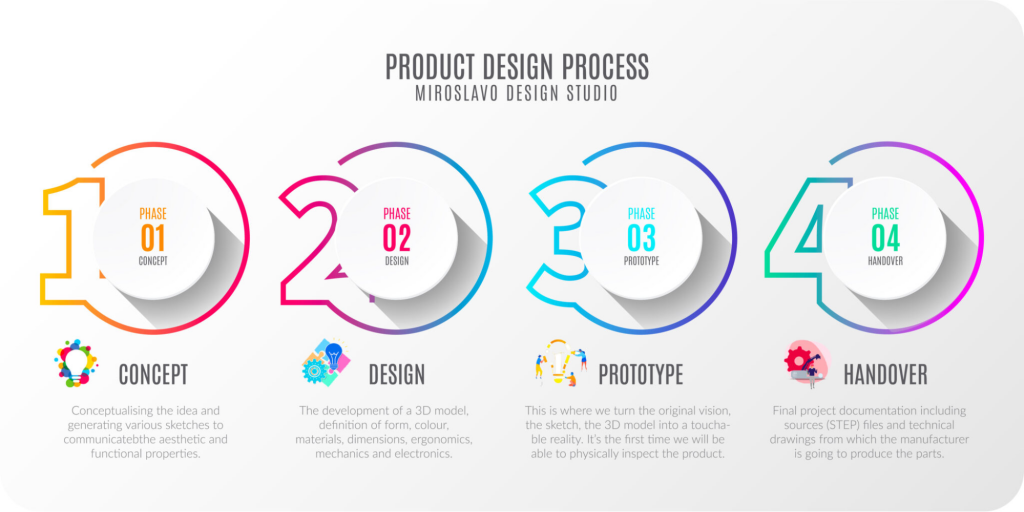
2. Turn Complicated Ideas into Easily Digestible Content
When you present something in a visual representation, it simplifies complex information and highlights the most important aspects of the process. Also, the use of colors, shapes, and lines can create a visual hierarchy.
As a result, it makes it easier for the audience to understand the flow and relationships between different elements. Moreover, using infographics you can present the information in a clear and concise manner. It reduces the amount of text required and makes the process easier to comprehend.
An example from Miroslavo shows how to explain phases that are undertaken in a product design project.
3. Improves Efficiency of your Email Campaigns
If you want to make your email campaigns look professional, add infographics to them. As we all know, people are more likely to read an email that has a visually appealing design. It grabs more attention from your subscribers and increases engagement with content.
Infographics make email campaigns more engaging and increases the likelihood that the recipient will understand the information being conveyed. To maximize the impact of infographics in emails, make sure they are well-designed and visually appealing.
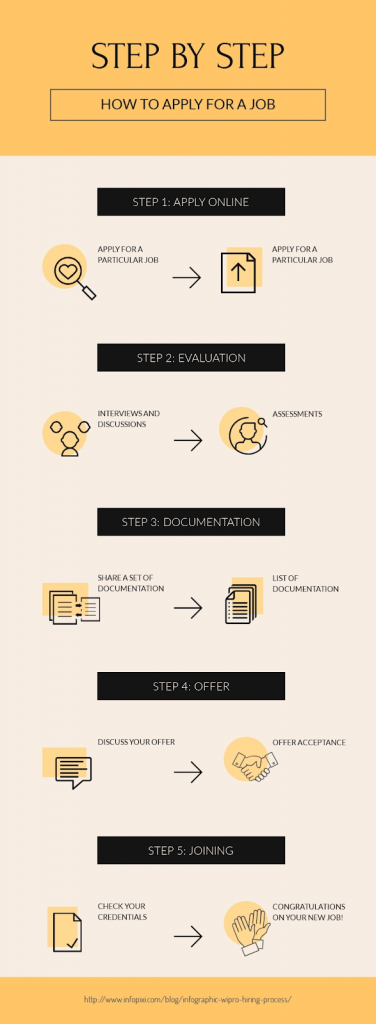
The above infographic form of a job application guide is easy to understand and memorize with the help of infographics. This infographic uses easy-to-read text, symbols, and appealing colors to easily understand the whole process in just a few minutes. Infographics can also be automated into specific channels using services like Gmail automation, making it easier for marketers to reach their target audience.
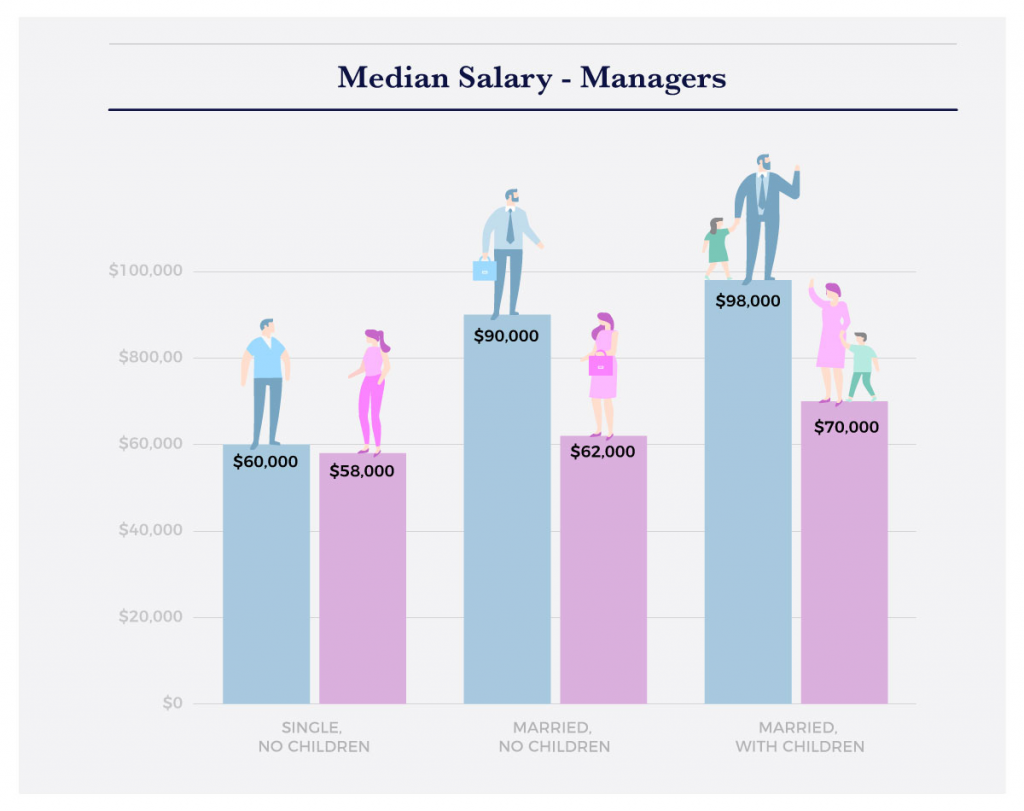
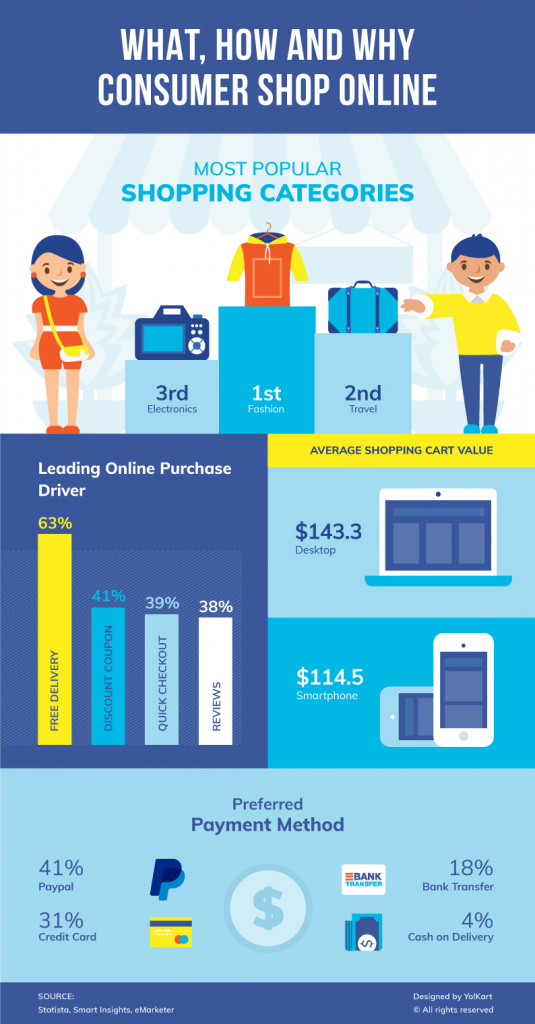
4. Visualize Data and Statistics
Let’s be honest! Raw data is boring. It’s even hard to understand data, numbers, and statistics.
Infographics are an excellent way to present data and statistics in a visual format. By using charts, graphs, data tables, and other visuals, you can make your data more accessible. It also simplifies complex data into easily understandable visuals by removing extraneous information, rounding numbers, and grouping data.
Infographics are especially useful for providing a comparison of data by adding labels and annotations to visual elements. You can also publish your infographics on social media, your website, or other channels to reach a wider target audience.
Here’s one example from Yo!Kart shows how data and statistics can be presented creatively in content.
5. Repurpose Previous Content
If you have a blog post or other piece of content that performed well, you can repurpose it into an infographic. This will allow you to share the information in a new and visually appealing format, which can help to increase engagement and drive more traffic to your site. However, make sure to link back this infographic to the original content, as this will drive traffic and increase the visibility of your older content.
By repurposing previous content into an infographic format, you can give it a fresh look, increase its reach, and provide your audience with a new and engaging way to consume your content.
Follow these steps to turn your blog into infographics;
Step 1
Your focus is to take out the most info that’s important, therefore, trim the fat, pick up the concise, most relevant data points to create an outline
Step 2
Use an infographic template and fill up the structure and use the content to add to the theme. At this point, the goal is to populate your template with the content you have gathered.
Step 3
Outreach and market it. Once your infographic is ready, it’s time to market. You can share via social media channels, your email newsletters, or any other fresh blog posts that you want to create.
6. Share Infographic Snippets on Social Media
While you can create infographics from scratch every time, adding infographics into social media strategy is a great way to save time, and improve engagement.
Sharing snippets of your infographics on social media platforms can help to increase the reach of your content and drive more traffic to your site. It is one of the best ways to attract and retain followers, build brand awareness, and establish yourself as a thought leader in your industry.
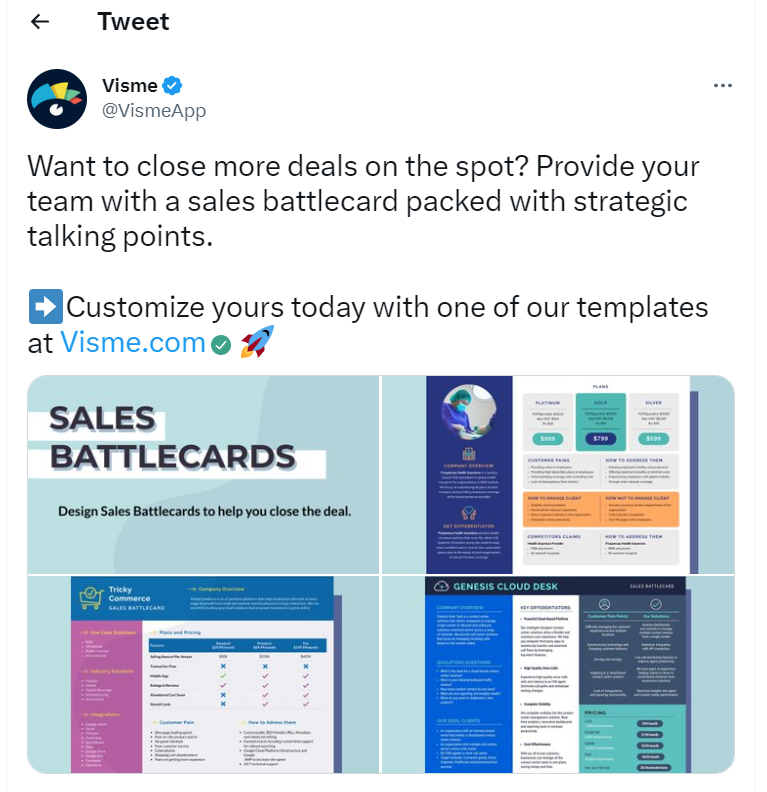
Additionally, social media algorithms often favor visually-rich content, which means that sharing infographic snippets can help improve your visibility and reach on platforms like Twitter, Facebook, Instagram, and LinkedIn. Here’s an example of a Visme tweet demonstrating how you can use infographic snippets on social media to get more traffic.
Infographic Content Marketing Tips
- Define your target audience: Determine who your target audience is and what they are interested in. This will help you create an infographic that appeals to them and meets their needs.
- Choose a topic: Decide on a topic that is relevant to your target audience and aligns with your brand’s mission and defined business goals.
- Research: Gather data and statistics that support your topic. Make sure the data is accurate and up-to-date.
- Design: Choose an eye-catching design that is easy to understand and follow. Use colors, images, and typography that appeal to your target audience.
- Create a compelling story: Use the data and statistics you have gathered to create a story that informs and educates your target audience.
- Make it shareable: Include social sharing buttons and embed code so that others can easily share your infographic on their websites and social media accounts.
- Promote: Share your infographic on your website, social media, and other online platforms. Reach out to influencers in your niche and ask them to share it as well.
- Analyze the results: Track your infographic’s performance and see how it is resonating with your target audience. Use this information to make improvements and create even better infographics in the future.
Wrapping Up
To sum up, infographics are engaging pieces of content with the potential to substantially boost your brand’s visibility. The ways of using infographics are numerous, it means the material holds an almost limitless potential to benefit your brand to the bottom line.
If done right, infographics can become powerful weapons in your marketing arsenal. So, before you jump on the infographic bandwagon though, be sure to do your due diligence and carefully research design trends, as well as trends in what types of visuals resonate best with your target audience.


Leave a comment!