
Business intelligence software should help you process and analyze corporate data to produce quality insights and help you understand the health of your business. Using a variety of formulas and metrics to measure, compare, and relate business indicators, good business intelligence software should make it possible to distinguish the strengths and weaknesses of every company. Put simply, data and metrics are at the heart of any useful business intelligence system which can help you make informed decisions to mitigate the business impact of critical threats like the COVID-19 pandemic.
Choosing a suitable business intelligence solution, however, can be a difficult, time-consuming task. Tableau, for example, is a powerful tool in the category but considering the unique way your business runs may require you to look elsewhere. To help you, we have created this quick business intelligence software comparison of the top 10 alternatives to Tableau.

What are the top 10 alternatives to Tableau?
When shopping around for business intelligence applications, you should be looking at these core functions: data discovery, data management, and reporting. Additionally, however, some of them also evaluate functionality and employee performance. For a more solid backgrounder on this software category— including factors to consider, issues and trends—you can check our detailed business intelligence guide report here.
By and large, business intelligence software has allowed companies to keep up with the unabating march of data complexity, liberating users from the entrenched ways of the past, making them comfortable with the idea of machines getting smarter, information democracy rising, and BI separating the winners from the losers. Over the years, businesses have come to recognize the importance of business intelligence. In 2020, 19.5% of businesses worldwide said that cloud business intelligence is critical to their organization and 34.5% said that it is very important to them. In contrast, only 16% said it was critical while 32% said it was very important to them in 2019.

A component of business intelligence is artificial intelligence. The pandemic has forced businesses to speed up their adoption of automation solutions using smart technologies, one of which is artificial intelligence. In 2021, experts predict that there is a lot in store for artificial intelligence. For one, businesses can now use AI for workforce planning, simulation, and modeling. Together with machine learning, AI can also be integrated into various business processes to provide better insights and improve customer service. It can even be used to analyze human emotions to address the shortcomings in technology that has been prevalently used due to the pandemic. Whatever the use case, AI has the potential to bring flexibility, visibility, and efficiency to business operations.
What is Tableau?

Launched in 2003, Tableau is a business intelligence system that helps companies visualize and understand their data. Using a revolutionary approach, the solution allows businesses to quickly connect, visualize, and share data with an efficient, seamless experience from the PC to the iPad. You can create and publish dashboards and share them with partners, colleagues, or customers—without the need for programming skills. If you’re already using a Tableau Service (Tableau Online or Tableau Server), there will be no obstacles to letting data flow seamlessly from one platform to the other.
Tableau Desktop is a self-service analytics solution that allows you to look at data and answer questions rapidly. Tableau Server, on the other hand, enables you to publish dashboards from your Tableau Desktop on any web browser or mobile-based device.
Benefits of Tableau
- Powerful analytics. Interactive, visual analysis lets you untangle thorny business questions and quickly get to the insights that propel your business forward. Powered by its patented VizQL technology, Tableau gives you powerful analytics to ask more profound questions and deliver more meaningful answers.
- Powerful, comprehensive platform. From connection through collaboration, Tableau gives you a robust, secure, and flexible end-to-end analytics platform for your data. Using Tableau for your data ensures your expectations are more than met.
- Connected to multiple data sources. Tableau’s productivity suite allows you to connect it to a number of data sources you’re already using, import, and visualize data in a matter of minutes. Unique technology gives it 10 to 100 times faster data analysis mechanism than what its competitors can offer.
- Multiple options to interact. Put your data anywhere you need it. With Tableau, you can securely consume your data via browser, desktop, mobile, or embedded into any application.
- Intuitive and easy interface. Tableau is incredibly easy to use, allowing you to bring data for analysis with few simple drag-and-drop moves. This means that the product is intuitive even for non-savvy users, and doesn’t take time, programming knowledge, or expensive training for teams to get a grasp of it.
- Advanced collaboration. Most of Tableau’s functionalities are collated on a public dashboard, where users can access and process data with only a few clicks. A dedicated mobile app for different devices ensures activities can be completed, regardless of the agent’s location. This allows agents to use the same application to share their achievements and invite colleagues to collaborate.
- Several methods for data investigation. Tableau investigates data in many different ways, starting with large, traditional dashboards, and ending up with complex cloud-based source explorations. Instead of conducting analyses with a single method, the user can combine approaches and data views to make insights richer. In the end, all conclusions are showcased in comprehensive data visualizations, made so simple that you can easily share them with clients and partners from different industries.
- Flexible pricing and deployment. Tableau lets you choose whether you want to deploy it in the cloud or on their local servers, and offers annual subscriptions and single-payment licenses to meet the capacity of different companies. This flexibility makes Tableau accessible to businesses from all scales and industries.
- Reliable support. Tableau gives users access to a reliable tech support team.
Top Alternatives to Tableau
1. Wyn Enterprise

Wyn Enterprise is a business intelligence software whose main selling point is its enterprise-grade self-service reporting. With its intuitive dashboard that lets you see all the data that you need in one single display, Wyn Enterprises also comes with the standard functionalities—and more—to a business intelligence application.
The software presents data so you can make better decisions. Wyn Enterprise comes with data governance, allowing you to manage your data availability, so your data is always secure as needed. With the addition of an interactive dashboard where you can create a plethora of charts, graphs, and other data visualizations. Wyn Enterprise also comes with other tools like data federation and modeling, automated distribution, ad hoc reporting, and multiple output channels. If you want to check its comprehensive feature set, you can make the most of the Wyn Enterprise free trial here.
Wyn Enterprise

Try out Wyn Enterprise with their free trial
Why use Wyn Enterprise instead of Tableau?
- Multi-tenancy support.
- Self-service business intelligence.
- Creation of pixel-perfect hard copies of reports.
- Scheduled and automatic distribution.
- Data governance and data federation.
Why use Tableau instead of Wyn Enterprise?
- It has four separate modules—Desktop, Server, Online, and Prep—for making sense of data, wherever you are.
- It has a shared dashboard with a commenting feature.
- Tableau Reader for data viewing and Tableau Public for data sharing.
- Allows you to string insights for a guided story.
If you’re looking for other software that’s more up your alley, you can take a look at Wyn Enterprise alternatives.
Detailed Wyn Enterprise Review
2. Zoho Analytics

Zoho Analytics is Zoho’s self-service business intelligence and analytics software that allows you to create insightful dashboards and data visualizations. A user-friendly tool that is easy to set up, Zoho Analytics is designed for use by SMB owners who seek an inexpensive yet efficient platform for their business needs. Start-ups will appreciate most of its features, which include data visualizations, online collaboration among team members, among other helpful business applications. For a growing company, there is an enterprise version available that’s more intuitive than what most competitions offer.
Easy to set up and fast to implement, Zoho Analytics lets you get started in just a few days, saving you huge amounts of time and effort. The tool’s spreadsheet-like interface and its intuitive drag-and-drop reports designer make it very easy to learn and use for any business. You can take advantage of the Zoho Analytics free trial to get to know its features better.
Zoho Analytics

Try out Zoho Analytics with their free trial
Why use Zoho Analytics instead of Tableau?
- Connect to any data source — import data from files, feeds, databases, cloud drives, popular business applications, and in-house apps.
- Visual analysis. Create reports and dashboards, with an easy drag-and-drop interface. Use different BI visualization tools to drill down to specifics.
- Secure online collaboration. Share and collaborate on reports and dashboards with your colleagues privately and reach a consensus quickly.
- Data blending. Combine data from different sources to create cross-functional reports, and thereby get more insights into your business.
- Powerful formula engine. Build formulae using an easy to use formula engine, offering extensive mathematical and statistical functions.
Why use Tableau instead of Zoho Analytics?
- It is easy to connect to different data sources: it can be connected to more than 40 different sources, including file-based data sources such as Excel and CSV, relational database data sources such as Teradata, SQL Server, DB2, OLAP data sources such as Microsoft Analysis Services, BW, cloud-based data sources such as Successfactors, Google Analytics, and Web Data Connector – web services as a source.
- Its built-in data connectors are free, and you need to pay licensing fees to use them. Use live connections or make use of Tableau extract engine for super-fast performance.
- It allows you to leverage the power of the database easily, connect to database views, and helps you optimize query performance.
You may check out these Zoho Reports alternatives for more options.
Detailed Zoho Analytics Review
3. Qualtrics Research Core

Qualtrics Research Core is an enterprise market research platform trusted by over 8,500 brands and 100 schools across the globe. Built to help users drive better business decisions, this is the first software solution to use AI in analyzing survey data for predicting market trends. It consists of a set of advanced intelligent features called Qualtrics IQ.
Whether you want to track consumer behavior, benchmark your company against competitors, conduct academic research, test products, or analyze your advertising efforts, Qualtrics Research Core can simplify and optimize it for you. This platform offers a plethora of state-of-the-art tools that can let you create, test, and modify surveys in an instant so that you can get actionable business insights as quickly as possible. You can check the Qualtrics Research Core free trial to get to know more about the product’s features.
Why use Qualtrics Research Core instead of Tableau?
- It has expert, skilled professionals who are available 24/7 by phone, email and chat to help you. This way, you won’t have to worry about experiencing lengthy downtimes.
- It offers both in-house implementation and can also partner with industry-specific companies, such as Walker, JD-Power, and Kantar.
- It offers Text IQ capability. Equipped with artificial intelligence and natural language processing, this tool analyzes open texts for you. It will then suggest relevant topics and assign sentiment scores to individual text comments.
- It eliminates the guesswork from the planning process using its Driver IQ function. Providing you with real-time data on your customers’ experiences, this tool will automatically correlate this information to prioritize the key drivers of your business. It can also predict the actions that will reap the best possible business impact to help you optimize your campaigns.
Why use Tableau instead of Qualtrics Research Core?
- It integrates with programming languages like R or Python, a great help in the field of data science.
- With Tableau, you are never alone. You can find inspiration from Tableau Community and Tableau bloggers, not to forget hours and hours of free online training. To hear the experiences of other Tableau business users at your countries, join Affecto events.
- It gives users access to a reliable tech support team, even automating data updates to help companies get fresh information without wasting their time.
Overwhelmed by the powerful features of Qualtrics Research Core? If simpler is more your cup of tea, then look at these Qualtrics Research Core alternatives too.
Detailed Qualtrics Research Core Review
4. Sisense

Sisense is a business intelligence platform that lets users join, analyze, and picture out information they require to make more intelligent business decisions and craft out workable plans and strategies. With Sisense, users can unify all the data they ever need and want into visually appealing dashboards via a drag-and-drop user interface.
Sisense allows users to turn data into highly valuable insights and share them with colleagues, business partners, and clients via interactive dashboards. Moreover, it is the leading business intelligence software for many companies, ranging from startups and developing enterprises to Fortune 500 giants, including NASDAQ, Sony, ESPN, Comcast, and NASA. You can leverage Sisense free demo and get to know the features firsthand at no cost and without commitment.
Sisense
Try out Sisense with their free trial
Why use Sisense instead of Tableau?
- You can export data to Images, Excel, PDF, CSV, and other formats.
- It identifies important metrics using filtering and calculations.
- The app handles data at scale on a single commodity server.
- It filters data by dropping fields on the canvas.
Why use Tableau instead of Sisense?
- It lets you analyze data in a way that drives decisions in a profitable direction.
- It connects to a number of data sources you’re already using, and imports and visualizes data in a matter of minutes.
- It offers a much faster data analysis mechanism compared to its competitors.
If Sisense does not cut to your requirements, you can look at these Sisense alternatives for more options.
Detailed Sisense Review
5. ActiveBatch

ActiveBatch is a powerful IT automation solution that provides reliable features amongst which the intelligent analytics tools stand out. Built to improve insights, the analytics module enables businesses to leverage data from multiple sources like databases, systems, and applications. It offers robust tools such as workflow monitoring, alerting tools, SLA monitoring, business intelligence features, and powerful reporting tools.
These tools help users to unearth the insight they need to pinpoint, monitor, and manage systems and workflows with ease. For example, with the workflow monitoring and alerting tools, it easy for users to identify issues early enough and resolve them before they cause gridlocks in the workflow. You can take a tour with the ActiveBatch free trial to learn more about the product capability.
Additionally, the powerful business intelligence tools provide the information users need to improve decision making. On the other hand, SLA monitoring tools help enforce policies to ensure the timely fulfillment of service levels. Even better, the platform provides multiple operation and developer views including machine load, forecast, and Gantt views. The views enable users to analyze data and derive insight into distinct functional areas.
Why use ActiveBatch instead of Tableau?
- ActiveBatch provides powerful reporting and business intelligence tools that improve decision making in the IT department.
- It offers dynamic visualizations that enable users to consume information faster.
- It also provides multiple operations and developer views that make it easy to analyze data based on functional areas.
- Moreover, the SLA monitoring tools help users to enforce policies to meet the desired service level.
Why use Tableau instead of ActiveBatch?
- Tableau comes with an intuitive user interface and an easy-to-use visualization builder.
- Additionally, the platform offers numerous data connections including text files, databases, and online tools.
- Even better, analyzing data with Tableau is fast and easy.
Finally, you may browse these ActiveBatch alternatives for other options.
Detailed ActiveBatch Review
6. Salesforce Analytics Cloud

Salesforce Analytics Cloud is a cloud-based business intelligence program that automates data discovery and ensures more efficient data visualization for any user in the organization. The platform offers end-to-end solutions, from setup and data migration to data sharing and collaboration.
The software offers various features that can be enabled and disabled according to users’ needs. For instance, users can choose to enable data sharing with other users and the ability to download data explorations. Once these features have been set up, users can start migrating data into Salesforce Analytics Cloud through the use of connectors, which can be used for integrating data from other Salesforce apps or from external sources such as Amazon Web Services and Google Analytics. After importing data into Salesforce Analytics Cloud, users can start preparing data sets, stories, apps, and AI models that they can share with team members.
Why use Salesforce Analytics Cloud instead of Tableau?
- Features can be enabled and disabled according to users’ needs.
- The system integrates data from a wide variety of internal and external sources, including Amazon Web Services and Google Analytics.
- It allows users to create a wide variety of charts and graphs for easier data visualization.
- Through Einstein Discovery, the software helps users discover insights and trends within data and make data-based predictions.
- Users can present data through live, interactive dashboards and annotate dashboard widgets.
Why use Tableau instead of Salesforce Analytics Cloud?
- Tableau has a user-friendly interface with drag-and-drop functions for integrating data.
- Data and visualizations are collected on an accessible public dashboard.
- Tableau Desktop offers live visual analytics to enable fast, limitless data exploration.
- Through the platform, users can create interactive maps with built-in postal codes and custom geocodes.
- The software offers enterprise-grade security and governance models.
If you want to learn more about business intelligence software with similar features, you can check these Salesforce Analytics Cloud alternatives.
Detailed Salesforce Analytics Cloud Review
7. Board

Board is an all-in-one business intelligence solution that combines core business intelligence functions, analytics, data discovery, and corporate performance management. It offers a wide range of sophisticated tools and features that help businesses simplify the process of finding relevant information, interacting with accurate data, and performing in-depth analyses. All relevant insights can also be automatically incorporated into the strategic planning process and simulation, which aid in fast decision-making.
Aside from streamlining the complex process of gathering and analyzing data, Board also equips its users with robust tools that they can use to create custom applications even without coding background or experience. All they have to do is utilize the drag-and-drop function to upload and configure relevant data before running analysis or simulation. Simulation applications and predictive models can also be designed and built from scratch to ensure that they are exactly what your business needs. Other features include automated drill down, drill through, and drill back suggestions; real-time modeling; reverse algorithm; multi-user concurrent entry; and MS Office integration, among many others.
Why use Board instead of Tableau?
- Board integrates with MS Office tools, such as Excel, Word, and PowerPoint.
- You can fully customize which process to automate and how.
- You can design and configure a simulation application even without a coding background.
- Board doubles as a corporate performance management solution.
- Board serves any type of businesses across different industries.
Why use Tableau instead of Board?
- Tableau integrates R or Python and other programming languages.
- It has a shared dashboard and public dashboard that allows other users to leave comments.
- It has dedicated functionalities for data viewing (Tableau Reader) and data sharing (Tableau Public).
Board’s pricing plan is quote-based and you may learn more about its quote-based plan in one of our articles. If you need more options, check out this list of Board alternatives.
Detailed Board Review
8. CXAIR Platform

Connexica’s CXAIR Platform is a data and business analytics software that can be deployed both from the cloud and on-premise. CXAIR allows you to unify disparate and sometimes conflicting data sets and make sense of them. Armed with such information, businesses can take action on certain operations.
CXAIR is meant to be used by organizations that deal with huge volumes of data daily. These include financial institutions, retail establishments, and healthcare. Obviously, these organizations need to extract useful insights from the data they discover and gather. With CXAIR, you can consolidate separate data streams and index them. And, as it’s powered by Apache’s Lucene search engine technology, you can retrieve data easily and accurately. This and many other features can be tested at no cost, thanks to the CXAIR Platform free trial.
Why use CXAIR Platform instead of Tableau?
- Optimized for rapid and accurate data retrieval with the Apache Lucene search engine technology.
- Single source of truth philosophy by consolidating different (sometimes conflicting) data sets.
- Flexibility and scalability to work with existing IT infrastructure.
- Self-service data discovery and analytics platform.
- User-friendly.
- Relatively affordable.
Why use Tableau instead of CXAIR Platform?
- Up to 100 times data analysis engine.
- No row limit so you can analyze millions of data.
- Designed for scale, so you don’t have to worry about overly-long processing times. All these give you more comprehensive visibility into your company without eating up resource time.
- Drag-and-drop UI and visualization builder.
- Public dashboards.
- Ability to analyze data using several approaches at once.
Other CXAIR alternatives are also available if you need a few other features that this solution doesn’t provide.
Detailed CXAIR Platform Review
9. Looker

Next on our list of the top 10 alternatives to Tableau is Looker, a data-discovery application that offers an intuitive approach to data exploration. It provides a web-based interface that you can use to gain actionable insight and generate useful business analytics.
Users can create and share reports easily for the benefit of other functional groups, effectively helping businesses drive their activities and decisions in the right direction. Looker also offers flexible pricing and open API integrations. The interface is intuitive, and the app is designed to eliminate data bottlenecks. More than 700 global companies use this solution to boost customer satisfaction and gain information from their website traffic. You can take advantage of the Looker free trial to learn more about the product features.
Why use Looker instead of Tableau?
- It is very easy to operate.
- It helps organizations make smarter business decisions through real-time access to data.
- It enables and streamlines collaboration among users.
- It is accessible on any browser and mobile device.
- It lets data and reports be shared via URLs or email.
- It’s easily integrated into different apps such as Google Docs and Excel, and even custom and third-party applications.
- It allows data to be manually exported in .csv or text files.
Why use Tableau instead of Looker?
- It is easy to use, letting you input data for analysis with a few simple drag-and-
- Its collaboration features offer a way to facilitate group analytics, ensuring all team members are on the same page.
- It investigates data in different ways, starting with large conventional dashboards and ending with complex cloud-based source explorations.
To offer you a wider choice, we present these viable Looker alternatives.
Detailed Looker Review
10. BigID
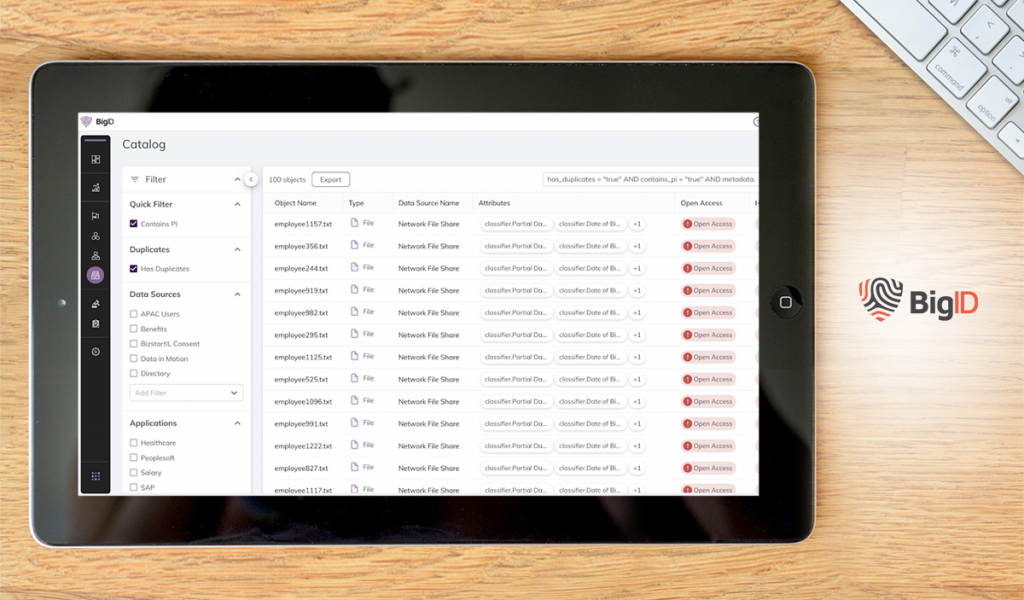
BigID is an innovative data intelligence system built by security industry veterans. Designed for large enterprises, this platform allows users to bring together their data in one hub. Essentially, the platform reads data from on-premise, cloud, and hybrid environments, catalogs them, and tags them accordingly. This way, it is easier to make sense of company data.
After which, it uses data privacy and security tools to keep your data safe and compliant with industry regulations. Additionally, BigID integrates with a variety of business applications so it is easier to consolidate data from across your IT infrastructure. The vendor offers a comprehensive free trial to get you up to speed with the features.
Why use BigID instead of Tableau?
- Easy to source and catalog data for seamless analysis.
- It’s purposely built to read data from on-premise, cloud, and hybrid environments.
- It offers comprehensive modules for data governance, discovery, security, and privacy.
- It comes with over 70,000 out-of-the-box retention policies for easy compliance management.
Why use Tableau instead of BigID?
- It allows you to make sense of data on desktops and mobile devices.
- It is easy to string insights for a guided story.
- Its dashboards feature an intuitive commenting feature.
- Moreover, Tableau is a gem in the field of data science as it supports programming languages such as Python and R.
If you still need more options, check out these BigID alternatives.
Detailed BigID Review
An intelligent choice for business intelligence
When you’re a manager, especially when you’re in the IT or operations department, a reliable and accessible business intelligence tool is a gift from the heavens. Such BI software can give you the empirical evidence you need to take action in a certain direction or reach a eureka moment. This is why modern companies often find business intelligence to be priceless—or at least approaching one.
Most software solutions that style themselves as “business intelligence tools” are a dime a dozen, unfortunately. This is why we have pored through the countless applications in the market and brought you the worthy competitors to one of our top-rated business intelligence software, Tableau. From our list, the best one is Wyn Enterprise as it combines powerful features like self-service BI, conversational AI, intuitive data preparation, and more. You can try out the product’s free trial for more information.
Better yet, you can combine the insights you gain from a business intelligence solution with another software to streamline your operations. Our list of business process management software can be a great complement to whatever BI platform you’re going to adopt for you to achieve greater operational efficiency in the midst of and even beyond the pandemic.


Leave a comment!